Pemuteran Monthly Rainfall & Precipitation
This page shows both the average monthly rainfall and the number of rainy days in Pemuteran, Bali, Indonesia. These averages rely on historical data collected over 30 years, from 1990 to 2020. Now, let's break down all the details for a clearer picture.
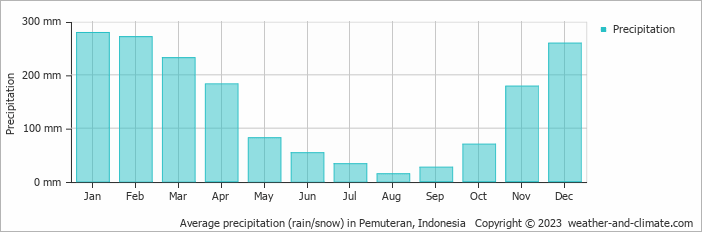
Pemuteran has a relatively rainy climate with high precipitation levels, averaging 1682 mm (66 in) of rainfall annually. Despite the high annual total, it does experience a distinct dry and rainy season during certain months. Examine our detailed charts below to understand these seasonal patterns.
Monthly Rainfall & Rainy Days
Monthly Precipitation Levels
The average number of days each month with precipitation (> 0.2 mm (0.01 in))
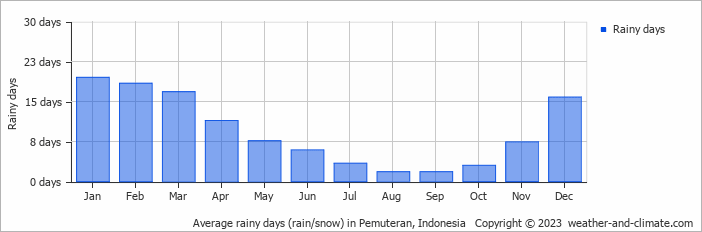
The climate in Pemuteran shows significant variation throughout the year. Expect 279 mm (11 in) of precipitation during the wettest month January, distributed over 20 rainy days.
In contrast, August offers drier and sunnier days, with around 14 mm (0.6 in) of rainfall over 2 rainy days.
January, the wettest month, has a maximum daytime temperature of 29°C (84°F). During the driest month August you can expect a temperature of 28°C (82°F). For more detailed insights into the city's temperatures, visit our Pemuteran Temperature page.
Daily Historical Precipitation
Average daily rainfall for each day of the month based on long-term records. 44-year average (1978-2025)
Average precipitation in August
Explore Pemuteran's Historical Precipitation: 1976-2026
Browse day-by-day precipitation records for Pemuteran spanning 51 years. Select any month and year to see actual rainfall and snowfall recorded on each day.
Annual Rainfall in Indonesia: City Comparison
The map below shows the annual precipitation across Indonesia. You can also select the different months in case you are interested in a specific month.
Pemuteran vs World: Rainfall Compared
Pemuteran's average annual precipitation is 1682 mm (66 in). Let's compare this to some popular worldwide tourist destinations:
In Barcelona, Spain, the average annual precipitation is 620 mm (24 in), evenly distributed across the year with no extreme wet or dry seasons.
Osaka, Japan, experiences 1507 mm (59 in) of rainfall annually, spread across the year with wetter summers.
Adelaide, Australia, enjoys 511 mm (20 in) of annual precipitation, with dry summers and wet winters.
Kuala Lumpur, Malaysia, receives 2529 mm (100 in) of annual rainfall, characteristic of its equatorial tropical rainforest climate, with consistent rainfall throughout the year and peak months during March and November.
Precipitation amounts are measured using specific gauges installed at weather stations, collecting both rain and snow and any other type of precipitation. Rainfall is measured directly in millimeters, while that from snow and ice is obtained by melting it. Automated systems often incorporate heaters to make this easier.
Information from these stations is transmitted via Wi-Fi, satellite, GPS, or telephone connections to central monitoring networks. This information is immediately updated and integrated into weather models and forecasts.
- The U.S. has a significant number of thunderstorms every year, with over 14.6 million taking place across the world annually.
- Approximately 70% of lightning bolts strike land rather than oceans.
- A storm named John was the longest-lasting Pacific tropical storm, continuing for 31 days. As it crossed the dateline twice, it changed status from a hurricane to a typhoon and back to a hurricane.
For more detailed information about Pemuteran's weather, including sunshine hours, humidity levels, and temperature data, visit our Pemuteran Climate page.
Pemuteran Weather by Month
Pick a month to see the average temperature, rainfall and sunshine in Pemuteran - and find the best time to visit.
Pemuteran 3-Day Forecast
Temperature Rainfall
See the full Pemuteran climate overview or explore weather in Indonesia.
Popular this month
Where to go in August - average daytime high across popular destinations.
Bucket list
Need travel inspiration? Check out our bucket list articles and be inspired.
 10 Hidden gems in Asia you need to visit
Explore 10 hidden gems in Asia offering authentic experiences, from pristine beaches and remote islands to cultural treks and peaceful mountain villages.
The ultimate guide to Ubud – everything you need to know to escape the crowds
There is a way to experience Ubud in a fantastic less crowded way and this article will be your guide how to do that. Find the best places to stay, where to eat and much more.
Top 5 hidden gem islands in Indonesia
Discover Indonesia's secret islands: pristine beaches, rich history, and vibrant culture await beyond Bali and Java. Dive into untouched paradise.
Six Organic Farms & Farmstays in Indonesia
We've compiled a list of organic farms in Indonesia that have a positive impact on their communities - they could use your help during this pandemic.