Linhares Monthly Rainfall & Precipitation
This page shows both the average monthly rainfall and the number of rainy days in Linhares, Espírito Santo, Brazil. These values are calculated using 30 years of data (1990–2020) to ensure accuracy. Now, let's explore all the details to give you a full picture.
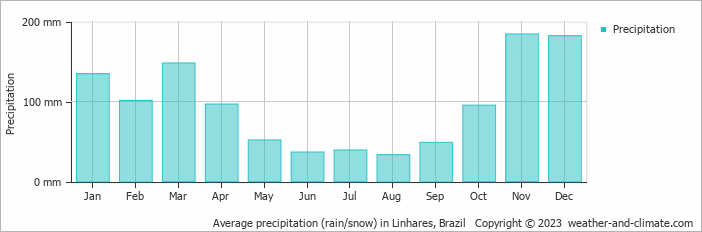
Linhares has a notably wet climate with abundant precipitation, recording 1151 mm (45 in) of rainfall per year. It does, however, have a distinct dry season during certain months. Have a look at our detailed charts below to see how precipitation varies throughout the year.
Monthly Rainfall & Rainy Days
Monthly Precipitation Levels
The average number of days each month with precipitation (> 0.2 mm (0.01 in))
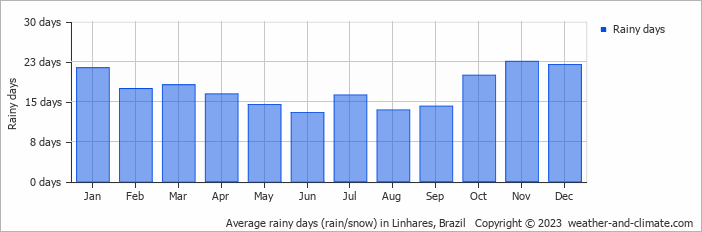
The seasons in Linhares, bring significant changes in precipitation. The wettest month, November, receives heavy rainfall, with an average of 184 mm (7.2 in) of precipitation. This rainfall is distributed across 23 rainy days.
In contrast, the driest month, August, experiences much less rainfall, totaling 33 mm (1.3 in) over 13 rainy days. These distinct seasonal differences provide diverse experiences throughout the year.November, the wettest month, has a maximum daytime temperature of 30°C (86°F). During the driest month August you can expect a temperature of 28°C (82°F). For more detailed insights into the city's temperatures, visit our Linhares Temperature page.
Annual Rainfall in Brazil: City Comparison
The map below shows the annual precipitation across Brazil. You can also select the different months in case you are interested in a specific month.
Linhares vs World: Rainfall Compared
Linhares's average annual precipitation is 1151 mm (45 in). Let's compare this to some popular worldwide tourist destinations:
Boston, USA, experiences 1238 mm (49 in) of annual precipitation, including significant snowfall during the winter.
Meanwhile, Buenos Aires, Argentina, enjoys a humid subtropical climate with 1000 mm (39 in) of annual rainfall, mostly in the summer.
In Brisbane, Australia, the annual precipitation is 979 mm (39 in), making it wetter than Sydney.
Bangkok, Thailand, experiences a tropical monsoon climate with 1668 mm (66 in) of annual rainfall, with the heaviest precipitation occurring during September and October.
Precipitation amounts are measured using specific gauges installed at weather stations, collecting both rain and snow and any other type of precipitation. Rainfall is measured directly in millimeters, while that from snow and ice is obtained by melting it. Automated systems often incorporate heaters to make this easier.
Information from these stations is transmitted via Wi-Fi, satellite, GPS, or telephone connections to central monitoring networks. This information is immediately updated and integrated into weather models and forecasts.
The proximity of a location to a large body of water can significantly affect its rainfall patterns:
- Ocean Influence: Coastal regions typically receive more rainfall due to the presence of moisture-laden winds from the ocean. These regions tend to have more humid climates and experience more frequent precipitation, especially in winter.
- Continental Climates: Areas further from the sea, such as inland or continental regions, experience less frequent rainfall and more extreme seasonal variations in precipitation.
- Mawsynram in India is noted as being the wettest place on earth, with over 11 meters (36 feet) of rain falling every year.
- In contrast, Antofagasta in Chile is among the driest places on the planet, getting less than 0.1mm (0.004 inches) per year, with some years recording virtually no rainfall.
- Nearly 1,650 thunderstorm cells are estimated over the planet at any given time.
For more detailed information about Linhares's weather, including sunshine hours, humidity levels, and temperature data, visit our Linhares Climate page.
Linhares Weather by Month
Pick a month to see the average temperature, rainfall and sunshine in Linhares - and find the best time to visit.
Linhares 3-Day Forecast
Temperature Rainfall
See the full Linhares climate overview or explore weather in Brazil.
Popular this month
Where to go in August - average daytime high across popular destinations.
Bucket list
Need travel inspiration? Check out our bucket list articles and be inspired.
 The 10 most alternative cities in South America
Discover South America's top 10 alternative cities! From Valparaíso's vibrant streets to La Paz's high-altitude charm and Medellín's innovative spirit.
 The 5 most tranquil retreats in the Amazon Rainforest, Brazil
Discover top sustainable lodges in the Amazon. Enjoy unique wildlife, eco-friendly stays, and immersive experiences at Anavilhanas, Cristalino, and more.
An alternative way to discover Rio de Janeiro
Don't feel like seeing the traditional tourist sights in Rio de Janeiro? We have made an overview of the sights in Rio de Janeiro that you must see if you want to visit Rio in an alternative way.
Iguazu Falls
Iguazu Falls are among the largest waterfalls on earth. You will be speechless when you see this miracle of mother nature. They are included in the World Heritage List and have also been named one of the seven wonders of the world.