

















 Tanzania in July: Zanzibar, Safari or Kilimanjaro?
Compare Tanzania weather in July for Zanzibar, Nungwi, Jambiani, Dar es Salaam and Moshi to plan a beach, safari or Kilimanjaro trip.
This page shows both the average monthly rainfall and the number of rainy days in Kizimkazi, Zanzibar, Tanzania. Long-term data from 1990 to 2020 was used to calculate these averages. Now, let's explore all the details to give you a full picture.
Kizimkazi is known for its substantial rainfall, with annual precipitation reaching 1153 mm (45 in). While the overall climate is wet, there are notable seasonal patterns that create interesting contrasts, as demonstrated in our graph below.
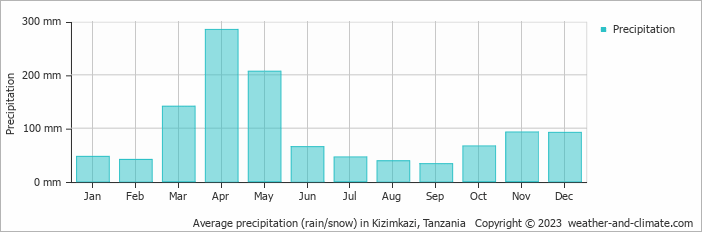
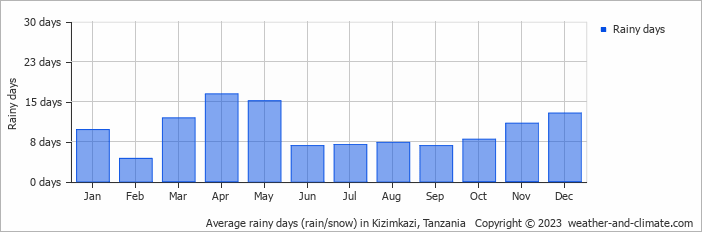
The climate in Kizimkazi shows significant variation throughout the year. Expect 285 mm (11 in) of precipitation during the wettest month April, distributed over 16 rainy days.
In contrast, September offers drier and sunnier days, with around 33 mm (1.3 in) of rainfall over 7 rainy days.
April, the wettest month, has a maximum daytime temperature of 29°C (84°F). The city receives 154 hours of sunshine in this period. During the driest month September you can expect a temperature of 27°C (81°F). For more detailed insights into the city's temperatures, visit our Kizimkazi Temperature page.
Average daily rainfall for each day of the month based on long-term records. 48-year average (1976-2025)
Browse day-by-day precipitation records for Kizimkazi spanning 51 years. Select any month and year to see actual rainfall and snowfall recorded on each day.
The map below shows the annual precipitation across Tanzania. You can also select the different months in case you are interested in a specific month.
Kizimkazi's average annual precipitation is 1153 mm (45 in). Let's compare this to some popular worldwide tourist destinations:
Seville, Spain, experiences 541 mm (21 in) of rainfall annually, with wet winters and dry summers typical of southern Spain.
In Shanghai, China, the annual average precipitation is 1347 mm (53 in), with a humid subtropical climate.
Adelaide, Australia, enjoys 511 mm (20 in) of annual precipitation, with dry summers and wet winters.
Ho Chi Minh City, Vietnam, receives 1955 mm (77 in) of annual rainfall, with a pronounced wet season from May to November, typical of its tropical monsoon climate.
Precipitation amounts are measured using specific gauges installed at weather stations, collecting both rain and snow and any other type of precipitation. Rainfall is measured directly in millimeters, while that from snow and ice is obtained by melting it. Automated systems often incorporate heaters to make this easier.
Information from these stations is transmitted via Wi-Fi, satellite, GPS, or telephone connections to central monitoring networks. This information is immediately updated and integrated into weather models and forecasts.
The proximity of a location to a large body of water can significantly affect its rainfall patterns:
For more detailed information about Kizimkazi's weather, including sunshine hours, humidity levels, and temperature data, visit our Kizimkazi Climate page.
Pick a month to see the average temperature, rainfall and sunshine in Kizimkazi - and find the best time to visit.
Temperature Rainfall Sunshine Humidity
See the full Kizimkazi climate overview or explore weather in Tanzania.
Where to go in September - average daytime high across popular destinations.
Dar es Salaam 30°C (86°F) Paje
 28°C (82°F) Zanzibar City29°C (84°F) Bwejuu28°C (82°F) Matemwe28°C (82°F) Jambiani28°C (82°F) Nungwi27°C (81°F) Moshi26°C (79°F)
 Need travel inspiration? Check out our bucket list articles and be inspired.
Tanzania in July: Zanzibar, Safari or Kilimanjaro?
Compare Tanzania weather in July for Zanzibar, Nungwi, Jambiani, Dar es Salaam and Moshi to plan a beach, safari or Kilimanjaro trip.
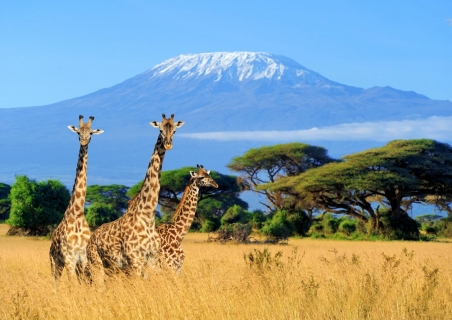 Climb the Kilimanjaro
The Kilimanjaro with its 5895 meters (19340 ft) is the roof of Africa. Climbing Kilimanjaro is a crazy experience and if you like adventure it’s an absolute must for the bucket list.
 The Serengeti
The Serengeti has wide, unending grasslands and is known for its spectacular sunsets. The park also offers the biggest wildlife population in the whole of Africa.
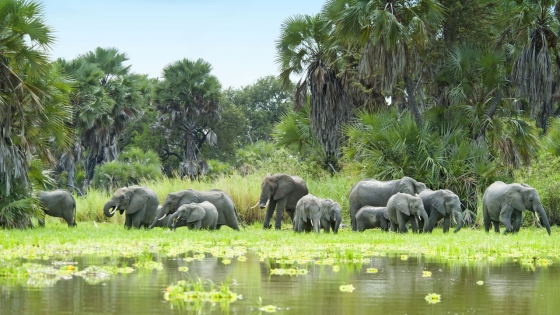 Walk Safari In the Selous Game Reserve
We feel the Selous Game Reserve is undoubtedly one of the most beautiful nature reserves in Tanzania and we recommend adding it to your bucket list. Here you can still experience the real Africa.