Kirmenjak Precipitation: Average Monthly Rainfall and Snowfall
This graph shows the average amount of rainfall per month in Kirmenjak (). The numbers are calculated over a 30-year period to provide a reliable average.
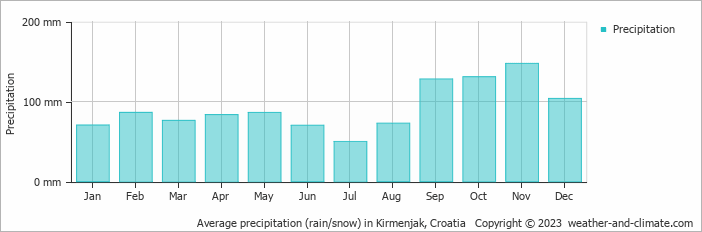
- A lot of rain (rainy season) falls in the months: September, October, November and December.
- On average, November is the wettest month with 147 mm of precipitation.
- On average, July is the driest month with 50 mm of precipitation.
- The average amount of annual precipitation is 1105 mm.
Current rainfall in Kirmenjak
Thu Dec 12
10°C | -1°C
E  11 km/h
11 km/hclear and no rain
Fri Dec 13
9°C | -3°C
E 11 km/h
11 km/h2.6 mm
almost clear and no rain
Sat Dec 14
8°C | 2°C
NW 11 km/h
11 km/h2.8 mm
partly cloudy and slight rain


