


















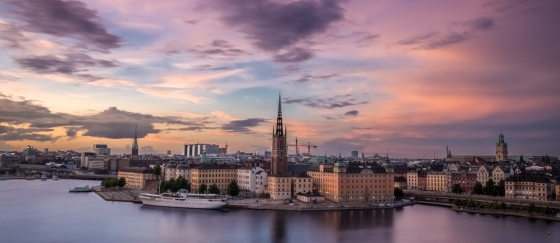
 Stockholm is one of the most beautiful cities in the world
The Swedish capital is special because of the mix of culture, nature and city. It's a city that should be on everyone's bucket list.
This page shows both the average monthly rainfall and the number of rainy days in Hishult, Halland, Sweden. This average is based on long-term data collected between 1990 and 2020. Let's now guide you through the details for a complete overview.
Generally, Hishult receives mid-range precipitation levels, with 936 mm (37 in) annually.
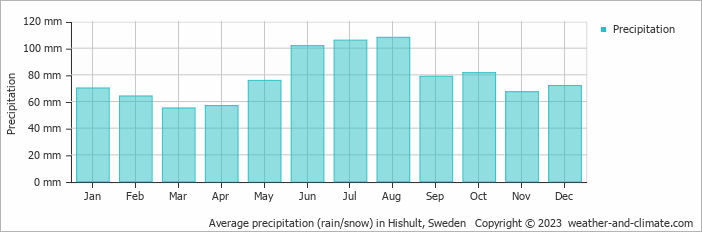
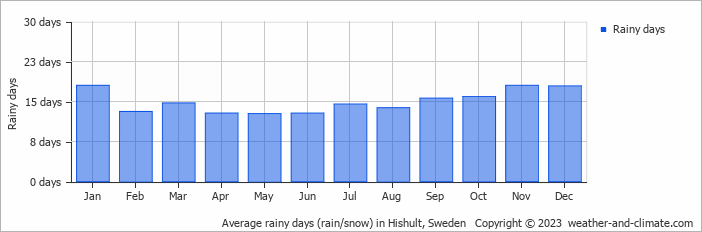
Hishult offers a pleasant mix of wetter and slightly drier months. The difference in precipitation between August (108 mm (4.3 in)) and March (55 mm (2.2 in)) is not too significant, making the climate enjoyable for visitors and residents alike.
August, the wettest month, has a maximum daytime temperature of 21°C (70°F). The city receives 198 hours of sunshine in this period. During the driest month March you can expect a temperature of 7°C (45°F). For more detailed insights into the city's temperatures, visit our Hishult Temperature page.
The map below shows the annual precipitation across Sweden. You can also select the different months in case you are interested in a specific month.
Hishult's average annual precipitation is 936 mm (37 in). Let's compare this to some popular worldwide tourist destinations:
In Barcelona, Spain, the average annual precipitation is 620 mm (24 in), evenly distributed across the year with no extreme wet or dry seasons.
In Shanghai, China, the annual average precipitation is 1347 mm (53 in), with a humid subtropical climate.
In Tokyo, Japan, the average annual precipitation is 1528 mm (60 in), with significant summer rains due to typhoon season.
Singapore, situated near the equator, gets 2581 mm (102 in) of rainfall annually, with no distinct dry season and consistent monthly precipitation.
Precipitation amounts are measured using specific gauges installed at weather stations, collecting both rain and snow and any other type of precipitation. Rainfall is measured directly in millimeters, while that from snow and ice is obtained by melting it. Automated systems often incorporate heaters to make this easier.
Information from these stations is transmitted via Wi-Fi, satellite, GPS, or telephone connections to central monitoring networks. This information is immediately updated and integrated into weather models and forecasts.
For more detailed information about Hishult's weather, including sunshine hours, humidity levels, and temperature data, visit our Hishult Climate page.
Pick a month to see the average temperature, rainfall and sunshine in Hishult - and find the best time to visit.
Temperature Rainfall Sunshine Humidity
See the full Hishult climate overview or explore weather in Sweden.
Where to go in October - average daytime high across popular destinations.
Malmö 13°C (55°F) Lund13°C (55°F) Karlskrona12°C (54°F) Falkenberg12°C (54°F) Simrishamn13°C (55°F) Gothenburg12°C (54°F) Visby12°C (54°F) Stockholm11°C (52°F)
 Need travel inspiration? Check out our bucket list articles and be inspired.
Stockholm is one of the most beautiful cities in the world
The Swedish capital is special because of the mix of culture, nature and city. It's a city that should be on everyone's bucket list.
 Nordic skating in Sweden
In between the snowy hills and dense pine forests you will find an innumerable amount of lakes in Sweden, large and small ones on which you can skate wonderfully.
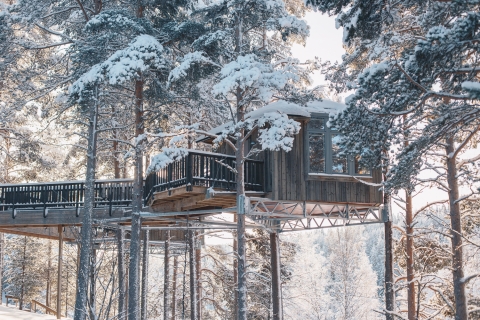 Sleep among the trees in Sweden
If you are looking for a tranquil retreat in Swedish Lapland we recommend to stay at Granó Beckasin. It has a fantastic location on the Ume river where you will experience silence and tranquility.
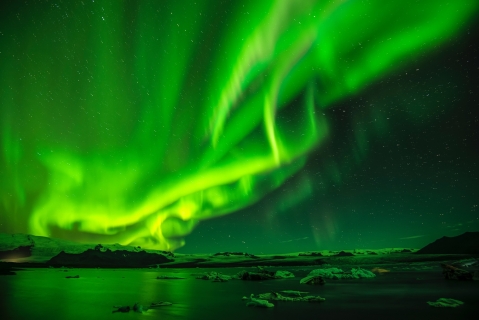
 See the northern lights
The northern lights, polar light or Aarora Borealis is a true spectacle of nature! Green, sometimes purple, red and yellow streaks of light colors the dark skies.