

















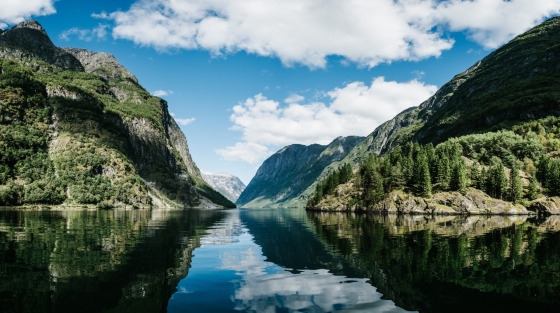
 The rugged landscape of the Norwegian fjords
This landscape is rated as the most beautiful in the world and it is something you need to experience at least once in your life.
This page shows both the average monthly rainfall and the number of rainy days in Fredrikstad, Østfold, Norway. The numbers reflect climate data gathered over a 30-year period, from 1990 to 2020. Now, let's break down all the details for a clearer picture.
Generally, Fredrikstad has a moderate amount of precipitation, averaging 922 mm (36 in) of rain/snowfall annually.
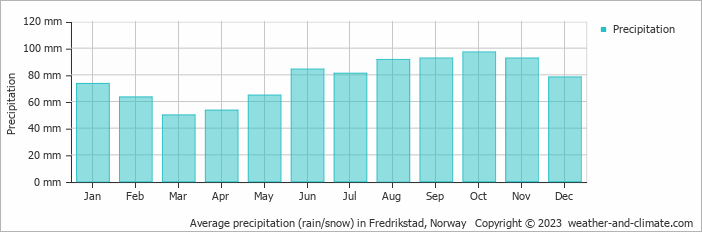
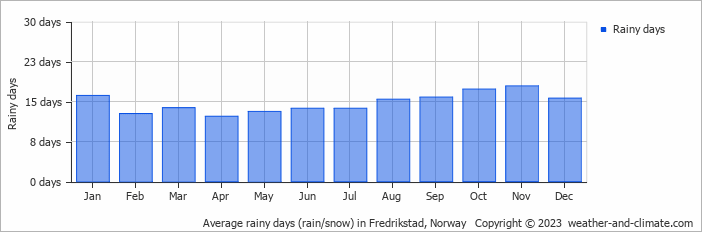
While rainfall varies throughout the year, each season offers its own charm. October brings wetter days averaging 97 mm (3.8 in) of precipitation, spread over 17 rainy days.
In contrast, March experiences a drier climate, with about 50 mm (2 in) of snow/rainfall spread across 14 snowy/rainy days.
October, the wettest month, has a maximum daytime temperature of 12°C (54°F). The city receives 85 hours of sunshine in this period. During the driest month March you can expect a temperature of 7°C (45°F). For more detailed insights into the city's temperatures, visit our Fredrikstad Temperature page.
The map below shows the annual precipitation across Norway. You can also select the different months in case you are interested in a specific month.
Fredrikstad's average annual precipitation is 922 mm (36 in). Let's compare this to some popular worldwide tourist destinations:
Boston, USA, experiences 1238 mm (49 in) of annual precipitation, including significant snowfall during the winter.
In Shanghai, China, the annual average precipitation is 1347 mm (53 in), with a humid subtropical climate.
In Brisbane, Australia, the annual precipitation is 979 mm (39 in), making it wetter than Sydney.
Singapore, situated near the equator, gets 2581 mm (102 in) of rainfall annually, with no distinct dry season and consistent monthly precipitation.
Precipitation amounts are measured using specific gauges installed at weather stations, collecting both rain and snow and any other type of precipitation. Rainfall is measured directly in millimeters, while that from snow and ice is obtained by melting it. Automated systems often incorporate heaters to make this easier.
Information from these stations is transmitted via Wi-Fi, satellite, GPS, or telephone connections to central monitoring networks. This information is immediately updated and integrated into weather models and forecasts.
Climate change is affecting precipitation patterns worldwide, including Fredrikstad:
For more detailed information about Fredrikstad's weather, including sunshine hours, humidity levels, and temperature data, visit our Fredrikstad Climate page.
Pick a month to see the average temperature, rainfall and sunshine in Fredrikstad - and find the best time to visit.
Temperature Rainfall Sunshine Humidity
See the full Fredrikstad climate overview or explore weather in Norway.
Where to go in September - average daytime high across popular destinations.
Kristiansand 17°C (63°F) Oslo16°C (61°F) Stavanger
 16°C (61°F) Bergen16°C (61°F) Trondheim16°C (61°F) Reine
 12°C (54°F) Tromsø12°C (54°F) Hemsedal11°C (52°F)
 Need travel inspiration? Check out our bucket list articles and be inspired.
The rugged landscape of the Norwegian fjords
This landscape is rated as the most beautiful in the world and it is something you need to experience at least once in your life.
 Discover Norway's Hidden Gem: The Littleisland Lighthouse
Explore Littleisland Lighthouse in Norway - a serene getaway offering unique stays, breathtaking views, and a journey into tranquil simplicity.
 The Majestic Geirangerfjord: Norway's Crown Jewel
Explore Norway's stunning Geirangerfjord, famous for its dramatic cliffs, waterfalls, and scenic routes. Breathtaking landscapes and outdoor adventures
 Swimming with orcas in Norway
The best travel period to travel to Norway for the orcas are the months October, November December, January and February. Swimming with orcas in Norway might be the bucket list trip of your life.