Cerveno Rainfall & Precipitation: Monthly Averages and Year-Round Insights
This page shows the average amount of rainfall per month in Cerveno. The numbers are calculated over a 30-year period to provide a reliable average. Now, let’s explore all the details to give you a full picture.
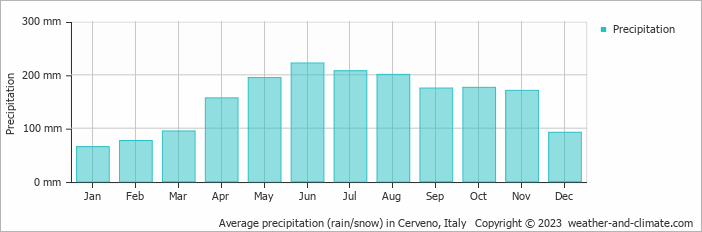
Cerveno experiences significant rain/snowfall throughout the year, averaging 1830 mm of precipitation annually.
Monthly Precipitation Levels
The average number of days each month with precipitation (> 0.2 mm)
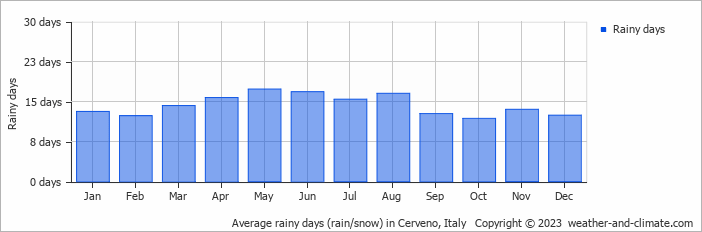
Significant seasonal changes in precipitation occur throughout the year. During the wet season, June receives substantial rainfall, averaging 222 mm of precipitation, recorded across 17 rainy days.
In contrast, the drier season, January brings less snowfall, with 65 mm over 13 snowy days.June, the wettest month, has a maximum daytime temperature of 18°C. During the driest month January you can expect a temperature of 0°C. For more detailed insights into the city’s temperatures, visit our Cerveno Temperature page.
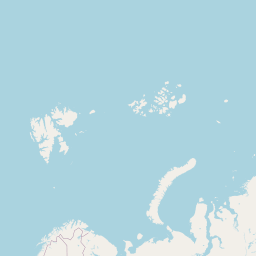
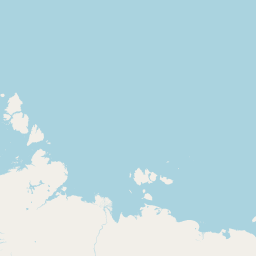
Annual Precipitation in Italy
The map below shows the annual precipitation across Italy. You can also select the different months in case you are interested in a specific month.


 heavy rainfall
 high
high
 moderate
 low
low
 almost none
Amsterdam Precipitation Compared World Wide
Cerveno’s average annual precipitation is 1830 mm. Let’s compare this to some popular worldwide tourist destinations:
New York City, USA, receives 1276 mm of rainfall annually, with precipitation evenly distributed throughout the year.
In Seoul, South Korea, the average annual precipitation is 1237 mm, with most rain falling during the summer monsoon season.
Adelaide, Australia, enjoys 511 mm of annual precipitation, with dry summers and wet winters.
Kuala Lumpur, Malaysia, receives 2529 mm of annual rainfall, characteristic of its equatorial tropical rainforest climate, with consistent rainfall throughout the year and peak months during March and November.
How is Precipitation Measured?
Precipitation amounts are measured using specific gauges installed at weather stations, collecting both rain and snow and any other type of precipitation. Rainfall is measured directly in millimeters, while that from snow and ice is obtained by melting it. Automated systems often incorporate heaters to make this easier.
Information from these stations is transmitted via Wi-Fi, satellite, GPS, or telephone connections to central monitoring networks. This information is immediately updated and integrated into weather models and forecasts.
Global Precipitation Patterns
Tropical Rainforests: In tropical regions, rainfall is generally abundant year-round. Areas near the equator, like the Amazon rainforest, can receive up to 3000 mm of rain annually.
Desert Regions: Deserts such as the Sahara and Arabian deserts typically see less than 250 mm of rainfall annually. Rainfall tends to be infrequent, but when it does occur, it is often intense.
Temperate Zones: In temperate regions, precipitation tends to be more evenly distributed, though areas closer to the ocean may see more rain in the winter months, and areas further inland experience drier summers.
Polar Regions: Precipitation in polar regions, like Antarctica, is extremely low, often falling as snow. Average annual precipitation in Antarctica is less than 200 mm, with some areas receiving as little as 50 mm annually.
For more detailed information about Cerveno’s weather, including sunshine hours, humidity levels, and temperature data, visit our Cerveno Climate page.
Current rainfall in Cerveno


