Boldogkőváralja Precipitation: Average Monthly Rainfall and Snowfall
This graph shows the average amount of rainfall per month in Boldogkőváralja (). The numbers are calculated over a 30-year period to provide a reliable average.
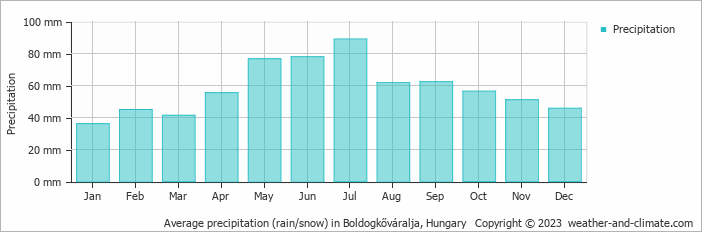
- On average, July is the wettest month with 89 mm of precipitation.
- On average, January is the driest month with 36 mm of precipitation.
- The average amount of annual precipitation is 698 mm.
Current rainfall in Boldogkőváralja
Fri Nov 15
5°C | -1°C
W  4 km/h
4 km/hbroken clouds and no rain
Sat Nov 16
6°C | -1°C
S 11 km/h
11 km/hpartly cloudy and no rain
Sun Nov 17
5°C | -1°C
SW 11 km/h
11 km/hpartly cloudy and no rain


