Bandungan Monthly Rainfall & Precipitation
This page shows both the average monthly rainfall and the number of rainy days in Bandungan, Central Java, Indonesia. Long-term data from 1990 to 2020 was used to calculate these averages. Let's explore the details to provide you with a complete overview.
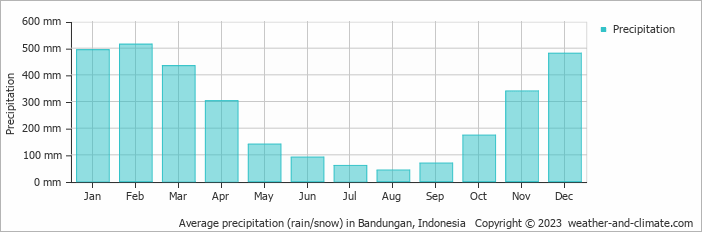
Bandungan is known for its substantial rainfall, with annual precipitation reaching 3138 mm (124 in). While the overall climate is wet, there are notable seasonal patterns that create interesting contrasts, as demonstrated in our graph below.
Monthly Rainfall & Rainy Days
Monthly Precipitation Levels
The average number of days each month with precipitation (> 0.2 mm (0.01 in))
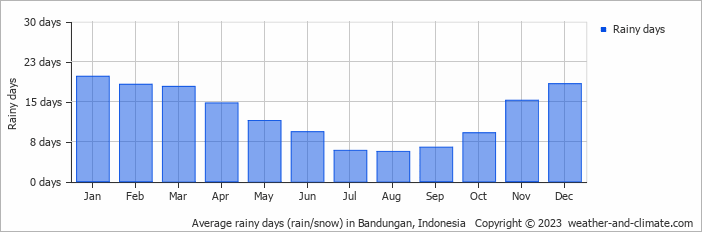
Significant seasonal changes in precipitation occur throughout the year. During the wettest month, February receives substantial rainfall, averaging 515 mm (20 in) of precipitation, recorded across 18 rainy days.
In contrast, the driest month, August brings less rainfall, with 43 mm (1.7 in) over 6 rainy days.
February, the wettest month, has a maximum daytime temperature of 29°C (84°F). During the driest month August you can expect a temperature of 30°C (86°F). For more detailed insights into the city's temperatures, visit our Bandungan Temperature page.
Annual Rainfall in Indonesia: City Comparison
The map below shows the annual precipitation across Indonesia. You can also select the different months in case you are interested in a specific month.
Bandungan vs World: Rainfall Compared
Bandungan's average annual precipitation is 3138 mm (124 in). Let's compare this to some popular worldwide tourist destinations:
New York City, USA, receives 1276 mm (50 in) of rainfall annually, with precipitation evenly distributed throughout the year.
In Seoul, South Korea, the average annual precipitation is 1237 mm (49 in), with most rain falling during the summer monsoon season.
Perth, Australia, receives 565 mm (22 in) of rainfall annually, mostly during the winter months.
Bangkok, Thailand, experiences a tropical monsoon climate with 1668 mm (66 in) of annual rainfall, with the heaviest precipitation occurring during September and October.
Precipitation amounts are measured using specific gauges installed at weather stations, collecting both rain and snow and any other type of precipitation. Rainfall is measured directly in millimeters, while that from snow and ice is obtained by melting it. Automated systems often incorporate heaters to make this easier.
Information from these stations is transmitted via Wi-Fi, satellite, GPS, or telephone connections to central monitoring networks. This information is immediately updated and integrated into weather models and forecasts.
Precipitation has a very strong role in determining the local climate and ecosystem:
- Changing Rainfall Patterns: Global warming causes drastic changes in the patterns of rainfall. Some areas have been experiencing increased frequency and intensity of rainfall, while other areas experience longer dry spells or even droughts.
- Local Impacts: Many regions are experiencing heavier rainfall in the winter months and drier, hotter summers. This affects agriculture, water resources, and ecosystems.
- The U.S. has a significant number of thunderstorms every year, with over 14.6 million taking place across the world annually.
- Approximately 70% of lightning bolts strike land rather than oceans.
- A storm named John was the longest-lasting Pacific tropical storm, continuing for 31 days. As it crossed the dateline twice, it changed status from a hurricane to a typhoon and back to a hurricane.
For more detailed information about Bandungan's weather, including sunshine hours, humidity levels, and temperature data, visit our Bandungan Climate page.
Bandungan Weather by Month
Pick a month to see the average temperature, rainfall and sunshine in Bandungan - and find the best time to visit.
Bandungan 3-Day Forecast
Temperature Rainfall Humidity
See the full Bandungan climate overview or explore weather in Indonesia.
Popular this month
Where to go in August - average daytime high across popular destinations.
Bucket list
Need travel inspiration? Check out our bucket list articles and be inspired.
 10 Hidden gems in Asia you need to visit
Explore 10 hidden gems in Asia offering authentic experiences, from pristine beaches and remote islands to cultural treks and peaceful mountain villages.
The ultimate guide to Ubud – everything you need to know to escape the crowds
There is a way to experience Ubud in a fantastic less crowded way and this article will be your guide how to do that. Find the best places to stay, where to eat and much more.
Top 5 hidden gem islands in Indonesia
Discover Indonesia's secret islands: pristine beaches, rich history, and vibrant culture await beyond Bali and Java. Dive into untouched paradise.
Six Organic Farms & Farmstays in Indonesia
We've compiled a list of organic farms in Indonesia that have a positive impact on their communities - they could use your help during this pandemic.