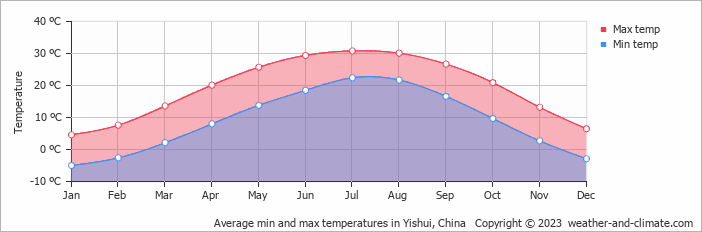
Yishui Temperature by Month
This graph shows the average minimum and maximum temperatures throughout the year in Yishui (), China. The minimum temperature is often recorded between 4 AM and 6 AM, while the highest temperature is usually reached at 3 PM. During this time the sun's heating effect is the strongest.
Temperature patterns do vary with the seasons. In winter, the time of minimum and maximum temperatures can shift slightly compared to summer.
- The months of April, May, June, September and October have nice average temperatures.
- On average, the warmest month(s) are June, July and August.
- On average, the warmest month is July with 31°C.
- On average, the coolest month is January with 5°C.
- The average annual maximum temperature is 19°C.
- The average annual minimum temperature is 9°C.
Current temperature in Yishui
Thu Sep 19
30°C | 24°C
E  11 km/h
11 km/h3.8 mm
broken clouds and rain
Fri Sep 20
30°C | 21°C
N 25 km/h
25 km/h0.8 mm
partly cloudy and rain
Sat Sep 21
23°C | 17°C
N 32 km/h
32 km/hpartly cloudy and no rain


