Yishui Precipitation: Average Monthly Rainfall and Snowfall
This graph shows the average amount of rainfall per month in Yishui (). The numbers are calculated over a 30-year period to provide a reliable average.
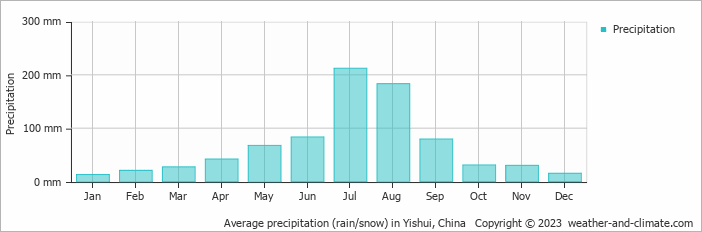
- Most rainfall (rainy season) is seen in July and August.
- Yishui has dry periods in January, February and December.
- On average, July is the wettest month with 212 mm of precipitation.
- On average, January is the driest month with 13 mm of precipitation.
- The average amount of annual precipitation is 803 mm.
Current rainfall in Yishui
Thu Sep 19
30°C | 24°C
E  11 km/h
11 km/h3.8 mm
broken clouds and rain
Fri Sep 20
30°C | 21°C
N 25 km/h
25 km/h0.8 mm
partly cloudy and rain
Sat Sep 21
23°C | 17°C
N 32 km/h
32 km/hpartly cloudy and no rain


