Trancoso Temperature by Month
The average annual maximum temperature in Trancoso, Bahia, Brazil is 28°C (82°F), with little variation between seasons. This page covers monthly averages, day-night differences, and how Trancoso compares to cities worldwide.
Trancoso Monthly Temperatures
With little seasonal fluctuation, Trancoso offers a predictable and steady climate. Maximum daytime temperatures reach a comfortable 30°C (86°F) in February and a comfortable 26°C (79°F) in July. At night, lows range from 24°C (75°F) to 21°C (70°F) throughout the year.
The chart below illustrates the average maximum day and minimum night temperatures in Trancoso by month:
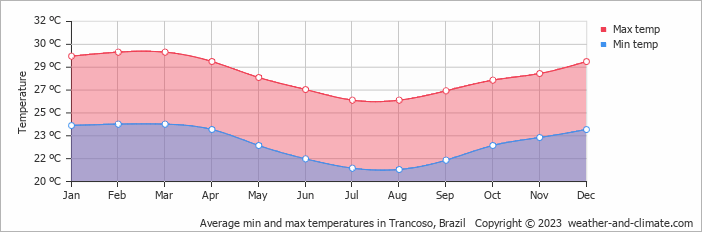
The coldest point of the day usually falls between 4 AM and 6 AM, with temperatures peaking around 3 PM.
The chart below shows the average temperature throughout the year:
Historical Trancoso Temperatures: 2002-2026
Browse day-by-day temperature records for Trancoso spanning 25 years. Select any month and year to see actual high and low temperatures recorded on each day.
Temperature: Trancoso vs Brazil
The map below shows the annual temperature across Brazil. You can also select individual months if you want to compare a specific time of year.
Trancoso vs World: Temperature Compared
Trancoso's average annual maximum temperature is 28°C (82°F). To put that in context, here's how it compares to a few well-known destinations:
Barcelona, Spain has an annual average of around 21°C (70°F), with warm summers and mild, fairly short winters.
Interlaken, Switzerland averages 8°C (46°F) a year, with cold winters and cool summers thanks to its Alpine setting.
New York City, USA averages 17°C (63°F) a year, with hot humid summers and cold winters that bring regular snowfall.
Melbourne, Australia averages 20°C (68°F) annually, known for unpredictable weather, with four seasons sometimes happening in one day.
Climate temperature data is typically calculated as a 30-year average. This smooths out year-to-year variability and gives a more reliable picture of what a place is actually like, rather than what happened in any single unusual year.
The readings come from a range of sources, land-based weather stations, ocean buoys, ships, and satellites. That data is collected by weather services around the world, then pooled, quality-checked, and averaged to produce the climate records you see here.
Seasonal temperature shifts influence more than just how warm it feels, they also drive changes in rainfall, cloud cover, and wind patterns throughout the year.
Warmer air holds more moisture, which tends to mean heavier or more frequent rain during the warmer months. When temperatures drop in winter, any precipitation that does fall is more likely to come as snow or sleet, though in Trancoso this rarely lasts long on the ground.
For more on Trancoso's weather, including monthly rainfall, sunshine hours, and humidity, visit our Trancoso climate page.
Trancoso Weather by Month
Pick a month to see the average temperature, rainfall and sunshine in Trancoso - and find the best time to visit.
Trancoso 3-Day Forecast
Temperature Rainfall
See the full Trancoso climate overview or explore weather in Brazil.
Popular this month
Where to go in August - average daytime high across popular destinations.
Bucket list
Need travel inspiration? Check out our bucket list articles and be inspired.
 The 10 most alternative cities in South America
Discover South America's top 10 alternative cities! From Valparaíso's vibrant streets to La Paz's high-altitude charm and Medellín's innovative spirit.
 The 5 most tranquil retreats in the Amazon Rainforest, Brazil
Discover top sustainable lodges in the Amazon. Enjoy unique wildlife, eco-friendly stays, and immersive experiences at Anavilhanas, Cristalino, and more.
An alternative way to discover Rio de Janeiro
Don't feel like seeing the traditional tourist sights in Rio de Janeiro? We have made an overview of the sights in Rio de Janeiro that you must see if you want to visit Rio in an alternative way.
Iguazu Falls
Iguazu Falls are among the largest waterfalls on earth. You will be speechless when you see this miracle of mother nature. They are included in the World Heritage List and have also been named one of the seven wonders of the world.