São Luís Temperature by Month
The average annual maximum temperature in São Luís, Maranhão, Brazil is 30°C (86°F), with little variation between seasons. This page covers monthly averages, day-night differences, and how São Luís compares to cities worldwide.
São Luís Monthly Temperatures
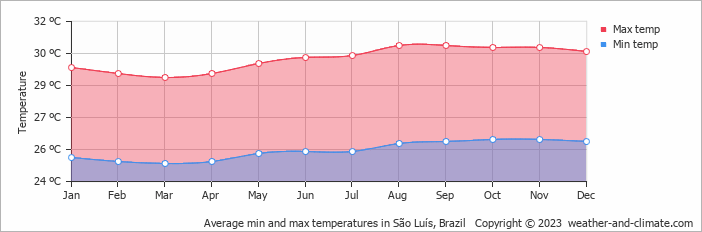
The temperature in São Luís changes very little across the seasons, maintaining a similar climate throughout the year. Maximum daytime temperatures range from a comfortable 29°C (84°F) in March to a very warm 31°C (88°F) in August. Nighttime lows range from 26°C (79°F) in August to 25°C (77°F) in March.
The chart below illustrates the average maximum day and minimum night temperatures in São Luís by month:
Low temperatures are most often recorded between 4 AM and 6 AM, while highs typically occur around 3 PM. August, the city's warmest month, sees 260 hours of sunshine.
The chart below shows the average temperature throughout the year:
Temperature: São Luís vs Brazil
The map below shows the annual temperature across Brazil. You can also select individual months if you want to compare a specific time of year.
São Luís vs World: Temperature Compared
São Luís's average annual maximum temperature is 30°C (86°F). To put that in context, here's how it compares to a few well-known destinations:
Rome, Italy averages 20°C (68°F) annually, with reliably warm summers and comfortable winters.
Reykjavík, Iceland averages 9°C (48°F) a year, mild summers by Icelandic standards, but cold winters and frequent wind.
Seoul, South Korea averages 18°C (64°F) a year, with four clear seasons, cold winters, and hot humid summers.
Brisbane, Australia averages 26°C (79°F) a year, with warm winters and hot, humid summers.
What Does the Temperature Feel Like in São Luís?
Temperature alone doesn't tell the whole story, humidity plays a big role in how warm or cold it actually feels. High humidity in summer makes the heat feel more intense, particularly once temperatures climb above 25°C. In winter, the same humidity can make cold air feel sharper than the thermometer suggests.
In São Luís, March is the coolest month, with average highs of 29°C (84°F) and humidity around 89%, considered very high. In August, the warmest month, temperatures average 31°C (88°F) with 84% humidity, conditions that feel very high. For a full picture, see our humidity page.
Climate temperature data is typically calculated as a 30-year average. This smooths out year-to-year variability and gives a more reliable picture of what a place is actually like, rather than what happened in any single unusual year.
The readings come from a range of sources, land-based weather stations, ocean buoys, ships, and satellites. That data is collected by weather services around the world, then pooled, quality-checked, and averaged to produce the climate records you see here.
Whether a city sits on the coast or deep inland makes a significant difference to its climate. Coastal areas tend to have more stable temperatures year-round, large bodies of water absorb heat slowly in summer and release it gradually in winter, keeping extremes in check. Cities far from the sea don't benefit from that buffer, which is why continental climates tend to have hotter summers and colder winters than their coastal counterparts at the same latitude.
For more on São Luís's weather, including monthly rainfall, sunshine hours, and humidity, visit our São Luís climate page.
São Luís Weather by Month
Pick a month to see the average temperature, rainfall and sunshine in São Luís - and find the best time to visit.
São Luís 3-Day Forecast
Temperature Rainfall Sunshine Humidity
See the full São Luís climate overview or explore weather in Brazil.
Popular this month
Where to go in July - average daytime high across popular destinations.
Bucket list
Need travel inspiration? Check out our bucket list articles and be inspired.
 The 10 most alternative cities in South America
Discover South America's top 10 alternative cities! From Valparaíso's vibrant streets to La Paz's high-altitude charm and Medellín's innovative spirit.
 The 5 most tranquil retreats in the Amazon Rainforest, Brazil
Discover top sustainable lodges in the Amazon. Enjoy unique wildlife, eco-friendly stays, and immersive experiences at Anavilhanas, Cristalino, and more.
An alternative way to discover Rio de Janeiro
Don't feel like seeing the traditional tourist sights in Rio de Janeiro? We have made an overview of the sights in Rio de Janeiro that you must see if you want to visit Rio in an alternative way.
Iguazu Falls
Iguazu Falls are among the largest waterfalls on earth. You will be speechless when you see this miracle of mother nature. They are included in the World Heritage List and have also been named one of the seven wonders of the world.