

















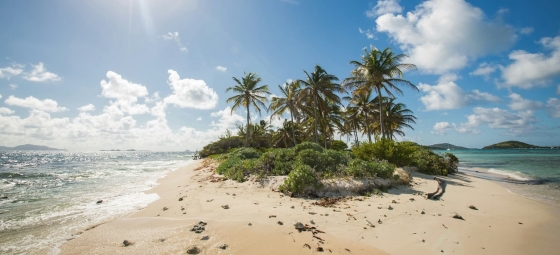
 10 Hidden gems in Asia you need to visit
Explore 10 hidden gems in Asia offering authentic experiences, from pristine beaches and remote islands to cultural treks and peaceful mountain villages.
Palembang in South Sumatra, Indonesia enjoys a stable climate, with daytime temperatures staying close to 33°C (91°F) throughout the year. Explore the full monthly breakdown below.
The temperature in Palembang remains steady throughout the year, providing a consistently very warm climate. Maximum daytime temperatures range from a very warm 34°C (93°F) in September to a very warm 31°C (88°F) in January. Nights are mild year-round, with lows ranging from 24°C (75°F) in September to 24°C (75°F) in January.
The chart below illustrates the average maximum day and minimum night temperatures in Palembang by month:
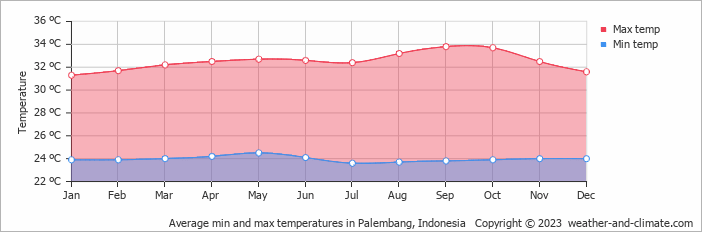
The minimum temperature is often recorded between 4 AM and 6 AM, while the highest temperature is usually reached at 3 PM, when the sun's heating effect is strongest. September, the warmest month, gets 122 hours of sunshine.
The chart below shows the average temperature throughout the year:
Average high and low temperatures for each day of the month based on long-term records. 47-year average (1976-2025)
Browse day-by-day temperature records for Palembang spanning 51 years. Select any month and year to see actual high and low temperatures recorded on each day.
The map below shows the annual temperature across Indonesia. You can also select individual months if you want to compare a specific time of year.
Palembang's average annual maximum temperature is 33°C (91°F). To put that in context, here's how it compares to a few well-known destinations:
Barcelona, Spain has an annual average of around 21°C (70°F), with warm summers and mild, fairly short winters.
Reykjavík, Iceland averages 9°C (48°F) a year, mild summers by Icelandic standards, but cold winters and frequent wind.
Osaka, Japan averages 22°C (72°F) annually, with hot humid summers, mild winters, and pleasant spring and autumn seasons.
Brisbane, Australia averages 26°C (79°F) a year, with warm winters and hot, humid summers.
Climate temperature data is typically calculated as a 30-year average. This smooths out year-to-year variability and gives a more reliable picture of what a place is actually like, rather than what happened in any single unusual year.
The readings come from a range of sources, land-based weather stations, ocean buoys, ships, and satellites. That data is collected by weather services around the world, then pooled, quality-checked, and averaged to produce the climate records you see here.
Seasonal temperature shifts influence more than just how warm it feels, they also drive changes in rainfall, cloud cover, and wind patterns throughout the year.
Warmer air holds more moisture, which tends to mean heavier or more frequent rain during the warmer months. When temperatures drop in winter, any precipitation that does fall is more likely to come as snow or sleet, though in Palembang this rarely lasts long on the ground.
For more on Palembang's weather, including monthly rainfall, sunshine hours, and humidity, visit our Palembang climate page.
Pick a month to see the average temperature, rainfall and sunshine in Palembang - and find the best time to visit.
See the full Palembang climate overview or explore weather in Indonesia.
Where to go in October - average daytime high across popular destinations.
Need travel inspiration? Check out our bucket list articles and be inspired.
10 Hidden gems in Asia you need to visit
Explore 10 hidden gems in Asia offering authentic experiences, from pristine beaches and remote islands to cultural treks and peaceful mountain villages.
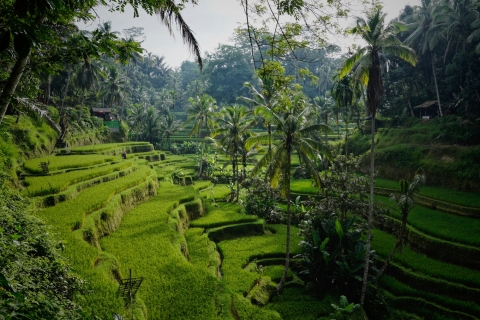 The ultimate guide to Ubud – everything you need to know to escape the crowds
There is a way to experience Ubud in a fantastic less crowded way and this article will be your guide how to do that. Find the best places to stay, where to eat and much more.
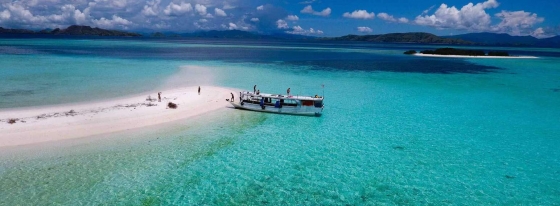 Top 5 hidden gem islands in Indonesia
Discover Indonesia's secret islands: pristine beaches, rich history, and vibrant culture await beyond Bali and Java. Dive into untouched paradise.
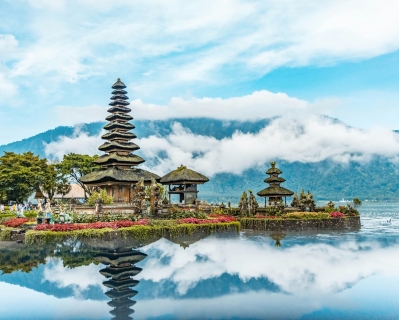 Indonesia in July: Bali, Java or Lombok?
Compare July weather in Bali, Lombok, the Gili Islands, Yogyakarta and Jakarta to find Indonesia's driest, sunniest and best beach conditions.