

















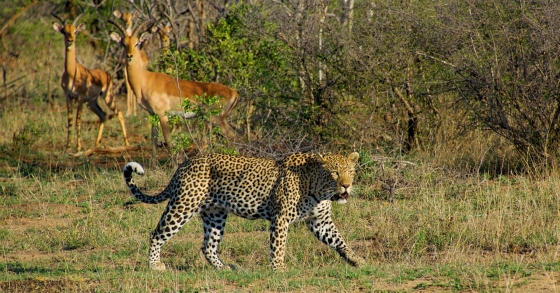
 Visit Kruger Park in South Africa
Are you going to South Africa, then you cannot skip the Kruger Park. The Kruger Park is one of the most beautiful and largest safari parks in the world.
Mashishing in Mpumalanga, South Africa enjoys a stable climate, with daytime temperatures staying close to 24°C (75°F) throughout the year. Explore the full monthly breakdown below.
With minimal seasonal shifts, Mashishing experiences a constant climate year-round. Maximum daytime temperatures range from a comfortable 26°C (79°F) in January to a pleasant 20°C (68°F) in July. At night, temperatures range from 16°C (61°F) in January to 5°C (41°F) in July.
The chart below illustrates the average maximum day and minimum night temperatures in Mashishing by month:
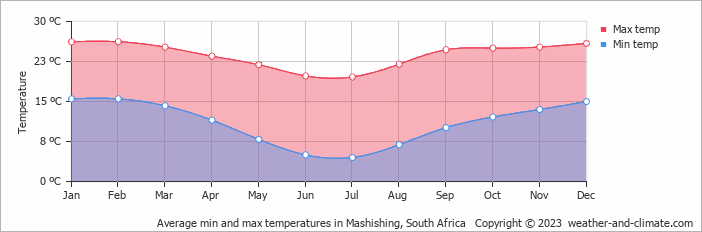
From around 4 AM to 6 AM temperatures are at their lowest; by 3 PM they've climbed to their daily peak.
The chart below shows the average temperature throughout the year:
The map below shows the annual temperature across South Africa. You can also select individual months if you want to compare a specific time of year.
Mashishing's average annual maximum temperature is 24°C (75°F). To put that in context, here's how it compares to a few well-known destinations:
Lisbon, Portugal averages 21°C (70°F) annually, warm summers, mild winters, and rain mainly in the cooler months.
Glasgow, Scotland averages 13°C (55°F) a year, mild but often grey, with cold winters and rarely hot summers.
Chicago, USA averages 15°C (59°F) annually, known for extreme seasonal swings, from bitterly cold winters to warm summers.
Brisbane, Australia averages 26°C (79°F) a year, with warm winters and hot, humid summers.
Climate temperature data is typically calculated as a 30-year average. This smooths out year-to-year variability and gives a more reliable picture of what a place is actually like, rather than what happened in any single unusual year.
The readings come from a range of sources, land-based weather stations, ocean buoys, ships, and satellites. That data is collected by weather services around the world, then pooled, quality-checked, and averaged to produce the climate records you see here.
For cities and regions with significant elevation, altitude is one of the biggest factors shaping local temperatures. As a rule of thumb, temperatures fall by around 6°C for every 1,000 metres gained, so a city at 2,000 metres will typically be around 12°C cooler than a city at sea level in the same region. Higher ground also tends to see more dramatic day-to-night temperature swings, since thinner air loses heat faster after sunset.
For more on Mashishing's weather, including monthly rainfall, sunshine hours, and humidity, visit our Mashishing climate page.
Pick a month to see the average temperature, rainfall and sunshine in Mashishing - and find the best time to visit.
Temperature Rainfall
See the full Mashishing climate overview or explore weather in South Africa.
Where to go in October - average daytime high across popular destinations.
Need travel inspiration? Check out our bucket list articles and be inspired.
Visit Kruger Park in South Africa
Are you going to South Africa, then you cannot skip the Kruger Park. The Kruger Park is one of the most beautiful and largest safari parks in the world.
 One of South Africa's most spectacular private game reserves
Sabi Sand Game Reserve is one of South Africa's most spectacular private game reserves. The chance that you see the entire Big Five is high in winter (June - August).

 Warm Days, Cool Nights: 8 Destinations With the Perfect Day-Night Temperature
Prefer warm sunny days but cool evenings? Compare eight destinations with daytime temperatures of around 25–30°C, cooler nights, low rainfall and plenty of sunshine.
 South Africa in November: Cape Town, Garden Route or East Coast?
Compare South Africa weather in November for Cape Town, Stellenbosch, Knysna, Durban and Johannesburg to find the driest and sunniest regions.