Killala Temperature by Month
Killala, Mayo, Ireland has an average annual maximum temperature of 13°C (55°F), with moderate seasonal shifts ranging from 9°C (48°F) in January to 18°C (64°F) in August. Below you'll find a full monthly breakdown and a comparison with cities worldwide.
Killala Monthly Temperatures
In Killala, seasonal changes bring about a moderate variation in temperatures. Nighttime lows range from 13°C (55°F) in August to 5°C (41°F) in January.
The chart below illustrates the average maximum day and minimum night temperatures in Killala by month:
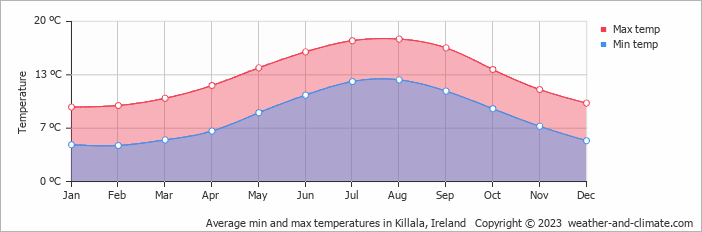
Temperatures tend to bottom out between 4 AM and 6 AM, then climb to their daily peak around 3 PM. August, the warmest month, sees 142 hours of sunshine.
The chart below shows the average temperature throughout the year:
Temperature: Killala vs Ireland
The map below shows the annual temperature across Ireland. You can also select individual months if you want to compare a specific time of year.
Killala vs World: Temperature Compared
Killala's average annual maximum temperature is 13°C (55°F). To put that in context, here's how it compares to a few well-known destinations:
Barcelona, Spain has an annual average of around 21°C (70°F), with warm summers and mild, fairly short winters.
Toronto, Canada averages 13°C (55°F) annually, with cold snowy winters balanced by genuinely warm summers.
Seoul, South Korea averages 18°C (64°F) a year, with four clear seasons, cold winters, and hot humid summers.
Adelaide, Australia averages 21°C (70°F) a year, with warm summers, mild winters, and relatively low rainfall year-round.
What Does the Temperature Feel Like in Killala?
Temperature alone doesn't tell the whole story, humidity plays a big role in how warm or cold it actually feels. High humidity in summer makes the heat feel more intense, particularly once temperatures climb above 25°C. In winter, the same humidity can make cold air feel sharper than the thermometer suggests.
In the cooler months, when temperatures drop below 10°C, high humidity makes the cold feel more cutting than it would in dry conditions.
In Killala, January is the coolest month, with average highs of 9°C (48°F) and humidity around 81%, considered very high. For a full picture, see our humidity page.
Climate temperature data is typically calculated as a 30-year average. This smooths out year-to-year variability and gives a more reliable picture of what a place is actually like, rather than what happened in any single unusual year.
The readings come from a range of sources, land-based weather stations, ocean buoys, ships, and satellites. That data is collected by weather services around the world, then pooled, quality-checked, and averaged to produce the climate records you see here.
Global average temperatures have risen by around 1.2°C since the pre-industrial era, and the effects are visible across many regions. Winters are milder on average, with fewer frost days and less snow in many parts of the world. Heatwaves are more frequent and more intense, and Europe's summers of 2018, 2019, and 2020 all set records.
Summers are also getting drier in some areas, while winter rainfall has increased in others. This contributies to higher river levels and more flooding. In many countries, spring arrives earlier and autumn lasts longer. It has knock-on effects for wildlife, agriculture, and local ecosystems.
For more on Killala's weather, including monthly rainfall, sunshine hours, and humidity, visit our Killala climate page.
Killala Weather by Month
Pick a month to see the average temperature, rainfall and sunshine in Killala - and find the best time to visit.
Killala 3-Day Forecast
Temperature Rainfall Sunshine Humidity
See the full Killala climate overview or explore weather in Ireland.
Popular this month
Where to go in August - average daytime high across popular destinations.
Bucket list
Need travel inspiration? Check out our bucket list articles and be inspired.
 Go to Dingle in Ireland
Dolphins, Whales and breathtaking views. The colorful fishing village Dingle in Ireland has it all and this town is a must for your bucket list.
An Irish adventure like no other in Killarney National Park
Head down to the South West part of the country, County Kerry, to the small town of Killarney. If you want to experience what Ireland is really all about
Horseback riding in Ireland
Ireland is the most ideal place in the world for horseback riding. Combine this with the most hospitable people you will ever encounter and you have an unforgettable dream trip to add to your bucket list.