















 Discover Kok Kood: a hidden gem in Thailand
Discover the hidden gem of Thailand - Koh Kood! Explore stunning beaches, waterfalls and eco-friendly resorts while enjoying a peaceful atmosphere away from the crowds.
Fang, Chiang Mai Province, Thailand has an average annual maximum temperature of 31°C (88°F), with moderate seasonal shifts ranging from 27°C (81°F) in December to 36°C (97°F) in April. Below you'll find a full monthly breakdown and a comparison with cities worldwide.
The weather in Fang changes moderately throughout the year, offering enough variation to appreciate each season. Nights are cooler, with lows ranging from 21°C (70°F) to 13°C (55°F).
The chart below illustrates the average maximum day and minimum night temperatures in Fang by month:
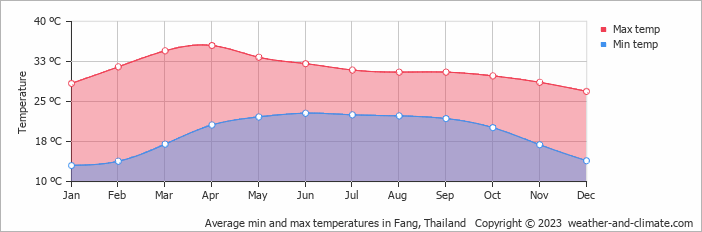
From around 4 AM to 6 AM temperatures are at their lowest; by 3 PM they've climbed to their daily peak. April, the warmest month, averages 281 hours of sunshine.
The chart below shows the average temperature throughout the year:
The map below shows the annual temperature across Thailand. You can also select individual months if you want to compare a specific time of year.
Fang's average annual maximum temperature is 31°C (88°F). To put that in context, here's how it compares to a few well-known destinations:
Seville, Spain averages 23°C (73°F) a year, one of the warmer cities in Western Europe, with long hot summers.
Reykjavík, Iceland averages 9°C (48°F) a year, mild summers by Icelandic standards, but cold winters and frequent wind.
Boston, USA averages 16°C (61°F) annually, with four distinct seasons and cold winters that rival northern Europe.
Tokyo, Japan averages 21°C (70°F) a year, with hot summers, cool winters, and a well-defined cherry blossom spring.
Temperature alone doesn't tell the whole story, humidity plays a big role in how warm or cold it actually feels. High humidity in summer makes the heat feel more intense, particularly once temperatures climb above 25°C. In winter, the same humidity can make cold air feel sharper than the thermometer suggests.
In Fang, December is the coolest month, with average highs of 27°C (81°F) and humidity around 77%, considered high. In April, the warmest month, temperatures average 36°C (97°F) with 66% humidity, conditions that feel high. For a full picture, see our humidity page.
Climate temperature data is typically calculated as a 30-year average. This smooths out year-to-year variability and gives a more reliable picture of what a place is actually like, rather than what happened in any single unusual year.
The readings come from a range of sources, land-based weather stations, ocean buoys, ships, and satellites. That data is collected by weather services around the world, then pooled, quality-checked, and averaged to produce the climate records you see here.
For cities and regions with significant elevation, altitude is one of the biggest factors shaping local temperatures. As a rule of thumb, temperatures fall by around 6°C for every 1,000 metres gained, so a city at 2,000 metres will typically be around 12°C cooler than a city at sea level in the same region. Higher ground also tends to see more dramatic day-to-night temperature swings, since thinner air loses heat faster after sunset.
For more on Fang's weather, including monthly rainfall, sunshine hours, and humidity, visit our Fang climate page.
Pick a month to see the average temperature, rainfall and sunshine in Fang - and find the best time to visit.
Temperature Rainfall Sunshine Humidity
See the full Fang climate overview or explore weather in Thailand.
Where to go in October - average daytime high across popular destinations.
Bangkok 33°C (91°F) Chiang Mai
 32°C (90°F) Jomtien Beach32°C (90°F) Ao Nang Beach30°C (86°F) Hua Hin31°C (88°F) Patong Beach29°C (84°F) Ko Lanta29°C (84°F)
 Need travel inspiration? Check out our bucket list articles and be inspired.
Discover Kok Kood: a hidden gem in Thailand
Discover the hidden gem of Thailand - Koh Kood! Explore stunning beaches, waterfalls and eco-friendly resorts while enjoying a peaceful atmosphere away from the crowds.

 Warm Days, Cool Nights: 8 Destinations With the Perfect Day-Night Temperature
Prefer warm sunny days but cool evenings? Compare eight destinations with daytime temperatures of around 25–30°C, cooler nights, low rainfall and plenty of sunshine.

 Where to Travel in July and August: Mexico, Thailand, Indonesia or Somewhere Else?
Compare July and August weather in Mexico, Thailand, Indonesia, Zanzibar and Sri Lanka, using historical climate data for temperature, rainfall and sunshine.
 Discover Thailand: An Ultimate Guide for Yogis
Explore Thailand's best for yogis: serene retreats, spiritual growth, and adventure. Dive into yoga, meditation, and nature's tranquility for an unforgettable journey.