La Orchila Temperature by Month
The average annual maximum temperature in La Orchila, Venezuela is 28°C (82°F), with little variation between seasons. This page covers monthly averages, day-night differences, and how La Orchila compares to cities worldwide.
La Orchila Monthly Temperatures
With minimal seasonal shifts, La Orchila experiences a constant climate year-round. Maximum daytime temperatures range from a comfortable 30°C (86°F) in September to a comfortable 27°C (81°F) in February. At night, temperatures range from 27°C (81°F) in September to 25°C (77°F) in February.
The chart below illustrates the average maximum day and minimum night temperatures in La Orchila by month:
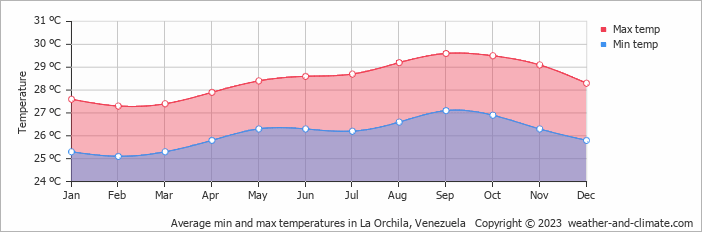
The coolest part of the day is typically between 4 AM and 6 AM, while 3 PM is usually the warmest, when solar heating is at its peak.
The chart below shows the average temperature throughout the year:
Historical La Orchila Temperatures: 1980-2026
Browse day-by-day temperature records for La Orchila spanning 47 years. Select any month and year to see actual high and low temperatures recorded on each day.
Temperature: La Orchila vs Venezuela
The map below shows the annual temperature across Venezuela. You can also select individual months if you want to compare a specific time of year.
La Orchila vs World: Temperature Compared
La Orchila's average annual maximum temperature is 28°C (82°F). To put that in context, here's how it compares to a few well-known destinations:
Rome, Italy averages 20°C (68°F) annually, with reliably warm summers and comfortable winters.
On the cooler end, Oslo, Norway averages just 10°C (50°F) annually, with pleasant summers but long, cold winters.
Boston, USA averages 16°C (61°F) annually, with four distinct seasons and cold winters that rival northern Europe.
Melbourne, Australia averages 20°C (68°F) annually, known for unpredictable weather, with four seasons sometimes happening in one day.
Climate temperature data is typically calculated as a 30-year average. This smooths out year-to-year variability and gives a more reliable picture of what a place is actually like, rather than what happened in any single unusual year.
The readings come from a range of sources, land-based weather stations, ocean buoys, ships, and satellites. That data is collected by weather services around the world, then pooled, quality-checked, and averaged to produce the climate records you see here.
Global average temperatures have risen by around 1.2°C since the pre-industrial era, and the effects are visible across many regions. Winters are milder on average, with fewer frost days and less snow in many parts of the world. Heatwaves are more frequent and more intense, and Europe's summers of 2018, 2019, and 2020 all set records.
Summers are also getting drier in some areas, while winter rainfall has increased in others. This contributies to higher river levels and more flooding. In many countries, spring arrives earlier and autumn lasts longer. It has knock-on effects for wildlife, agriculture, and local ecosystems.
For more on La Orchila's weather, including monthly rainfall, sunshine hours, and humidity, visit our La Orchila climate page.
La Orchila Weather by Month
Pick a month to see the average temperature, rainfall and sunshine in La Orchila - and find the best time to visit.
La Orchila 3-Day Forecast
Temperature Rainfall Water Temp
See the full La Orchila climate overview or explore weather in Venezuela.
Popular this month
Where to go in July - average daytime high across popular destinations.
Bucket list
Need travel inspiration? Check out our bucket list articles and be inspired.
 Visit Angel Falls
There are many Waterfalls in South Amerika to visit, however The Angel Falls is a waterfall like no other. This world heritage park needs to undoubtedly be on your bucket list.
Go to Merida in Venezuela
Mérida is a laidback backpacker city and is full of students. The university city is the cultural center of the Andes and with a special location at 1700 meters a must for every traveler.
 Mount Roraima is one of the most spectacular treks in Latin America
Mount Roraima, the feeling is indescribable. This is where the world seems to stop. As if you are on the roof of the world. Something you need to add to the bucket list.