La Orchila Monthly Rainfall & Precipitation
This page shows both the average monthly rainfall and the number of rainy days in La Orchila, Venezuela. Long-term data from 1990 to 2020 was used to calculate these averages. Now, let's explore all the details to give you a full picture.
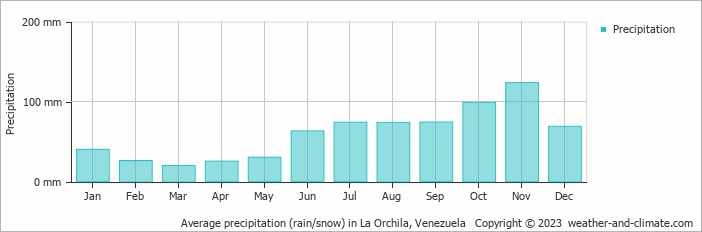
Generally, La Orchila experiences moderate precipitation patterns, averaging 716 mm (28 in) yearly. However, this average masks significant seasonal variation, including a distinct dry season during certain months that are clearly visible in our monthly breakdown below.
Monthly Rainfall & Rainy Days
Monthly Precipitation Levels
The average number of days each month with precipitation (> 0.2 mm (0.01 in))
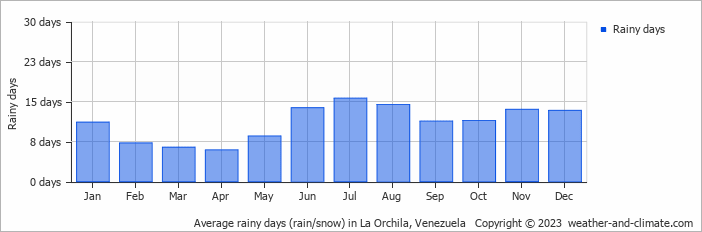
The climate in La Orchila shows significant variation throughout the year. Expect 123 mm (4.8 in) of precipitation during the wettest month November, distributed over 14 rainy days.
In contrast, March offers drier and sunnier days, with around 20 mm (0.8 in) of rainfall over 6 rainy days.
November, the wettest month, has a maximum daytime temperature of 29°C (84°F). During the driest month March you can expect a temperature of 27°C (81°F). For more detailed insights into the city's temperatures, visit our La Orchila Temperature page.
Explore La Orchila's Historical Precipitation: 1980-2026
Browse day-by-day precipitation records for La Orchila spanning 47 years. Select any month and year to see actual rainfall and snowfall recorded on each day.
Annual Rainfall in Venezuela: City Comparison
The map below shows the annual precipitation across Venezuela. You can also select the different months in case you are interested in a specific month.
La Orchila vs World: Rainfall Compared
La Orchila's average annual precipitation is 716 mm (28 in). Let's compare this to some popular worldwide tourist destinations:
The climate in San Francisco, USA, is influenced by coastal weather, with 469 mm (18 in) of rainfall mostly during the winter months.
Osaka, Japan, experiences 1507 mm (59 in) of rainfall annually, spread across the year with wetter summers.
Perth, Australia, receives 565 mm (22 in) of rainfall annually, mostly during the winter months.
Bangkok, Thailand, experiences a tropical monsoon climate with 1668 mm (66 in) of annual rainfall, with the heaviest precipitation occurring during September and October.
Precipitation amounts are measured using specific gauges installed at weather stations, collecting both rain and snow and any other type of precipitation. Rainfall is measured directly in millimeters, while that from snow and ice is obtained by melting it. Automated systems often incorporate heaters to make this easier.
Information from these stations is transmitted via Wi-Fi, satellite, GPS, or telephone connections to central monitoring networks. This information is immediately updated and integrated into weather models and forecasts.
- Mawsynram in India is noted as being the wettest place on earth, with over 11 meters (36 feet) of rain falling every year.
- In contrast, Antofagasta in Chile is among the driest places on the planet, getting less than 0.1mm (0.004 inches) per year, with some years recording virtually no rainfall.
- Nearly 1,650 thunderstorm cells are estimated over the planet at any given time.
For more detailed information about La Orchila's weather, including sunshine hours, humidity levels, and temperature data, visit our La Orchila Climate page.
La Orchila Weather by Month
Pick a month to see the average temperature, rainfall and sunshine in La Orchila - and find the best time to visit.
La Orchila 3-Day Forecast
Temperature Rainfall Water Temp
See the full La Orchila climate overview or explore weather in Venezuela.
Popular this month
Where to go in July - average daytime high across popular destinations.
Bucket list
Need travel inspiration? Check out our bucket list articles and be inspired.
 Visit Angel Falls
There are many Waterfalls in South Amerika to visit, however The Angel Falls is a waterfall like no other. This world heritage park needs to undoubtedly be on your bucket list.
Go to Merida in Venezuela
Mérida is a laidback backpacker city and is full of students. The university city is the cultural center of the Andes and with a special location at 1700 meters a must for every traveler.
 Mount Roraima is one of the most spectacular treks in Latin America
Mount Roraima, the feeling is indescribable. This is where the world seems to stop. As if you are on the roof of the world. Something you need to add to the bucket list.