












 Visit Angel Falls
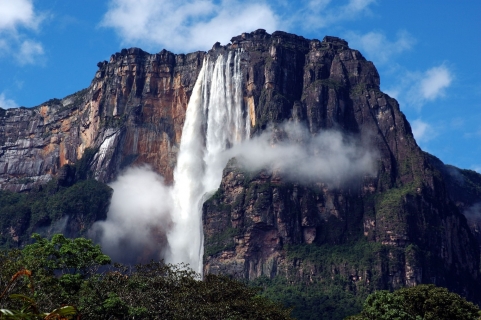
There are many Waterfalls in South Amerika to visit, however The Angel Falls is a waterfall like no other. This world heritage park needs to undoubtedly be on your bucket list.
La Orchila in November averages 29°C (84°F) during the day and 26°C (79°F) at night. This is the wettest month of the year.
For La Orchila itself, January, February, March, April, May, June, July, August and December generally stand out with the best circumstances. If you're seeking pleasant, dry and sunny weather somewhere else in the world, our weather planner can help you explore other options.
 Min Temperature
Max Temperature
Water Temperature
Min Temperature
Max Temperature
Water Temperature
 Chance of Rain
Precipitation
Rainy days
Chance of Rain
Precipitation
Rainy days
Pick a month to see the average temperature, rainfall and sunshine in La Orchila - and find the best time to visit.
Browse day-by-day weather records for La Orchila spanning 47 years. Select any month and year to see actual temperatures, rainfall, and conditions recorded on each day.
The extremes listed below come from historical weather data collected in La Orchila from 2006 through 2025.
Find out more about the weather in Venezuela and which places have the best travel conditions in this month. See all of Venezuela in November →
Perfect weather is subjective. On this map perfect weather has been defined with temperatures between 20°C (68°F) and 29°C (84°F) and not too much precipitation (less than 90 mm (3.5 in) a month).
Warm temperatures in November make for comfortable sightseeing weather. Pack breathable fabrics like cotton shirts, knee-length shorts or skirts, and comfortable walking shoes. A thin long sleeve for indoor spaces is handy. Prepare for significant rainfall with proper waterproof clothing and shoes. With water temperatures around 28°C (82°F), swimming conditions are excellent. Pack your swimsuit, goggles, and maybe some water shoes.
We rated the following activities from 1 (least suitable) to 10 (best) to do.


Temperature Rainfall Water Temp
See the full La Orchila climate overview or explore weather in Venezuela.
Where to go in November - average daytime high across popular destinations.
Need travel inspiration? Check out our bucket list articles and be inspired.
Visit Angel Falls
There are many Waterfalls in South Amerika to visit, however The Angel Falls is a waterfall like no other. This world heritage park needs to undoubtedly be on your bucket list.
 Go to Merida in Venezuela
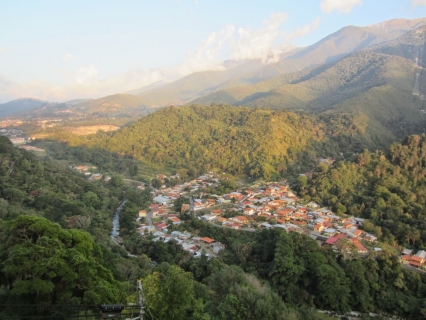
Mérida is a laidback backpacker city and is full of students. The university city is the cultural center of the Andes and with a special location at 1700 meters a must for every traveler.

 Mount Roraima is one of the most spectacular treks in Latin America
Mount Roraima, the feeling is indescribable. This is where the world seems to stop. As if you are on the roof of the world. Something you need to add to the bucket list.

 Visit the Rainbow Mountains
The Rainbow Mountain (Vinicunca) is acolored rainbow mountain that will steal your heart forever and the view from the top will take your breath away.