Ubatuba Sunshine Hours by Month
Sunshine is key to understanding how a place experiences its seasons. This page shows the total number of hours of direct sunlight per month and the average hours per day in Ubatuba, São Paulo State, Brazil. These averages rely on historical data collected over 30 years, from 1990 to 2020.
Monthly hours of sunshine
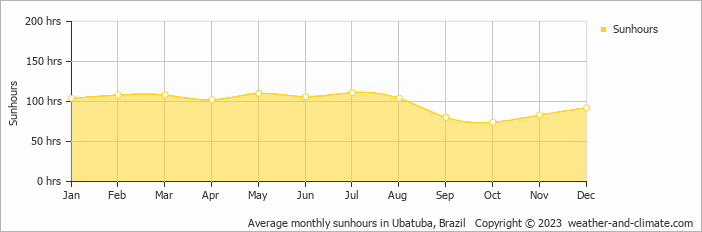
Ubatuba experiences sunny spells throughout the year. The sunniest month, July, sees up to 111 hours of sunshine, while October, the least sunny month, still provides a respectable 74 hours. The total annual sunshine amounts to 1182 hours.
Daily hours of sunshine
The difference in daily sunshine hours between July (3.7 hours per day) and October (2.5 hours per day) offers moderate variety for visitors and residents.
Ubatuba vs Major Cities: Sunshine Compared
Ubatuba enjoys an average of 1182 hours of sunshine annually. Let’s compare this with some popular tourist destinations:
In Barcelona, Spain, there are 2530 hours of sunshine annually and is a city that can be visited year-round.
In contrast, Juneau, Alaska, receives only about 1523 hours of sunshine per year and is known for its very short days in winter and frequently overcast conditions.
In Seoul, South Korea, there are approximately 2133 hours of sunshine per year, mostly during spring and autumn.
Adelaide, Australia, enjoys 2770 hours of sunshine annually, with long, sunny summers.
Related Climate Data for Ubatuba
January, Ubatuba’s wettest month, receives 219 mm (8.6 in) of rainfall and has a maximum daytime temperature of 27°C (81°F). During the driest month August you can expect a temperature of 23°C (73°F).
For more detailed insights into the city’s temperatures, check out our Temperature page. To explore more about precipitation patterns, visit our Ubatuba Precipitation page.
Ubatuba Weather by Month
Pick a month to see the average temperature, rainfall and sunshine in Ubatuba - and find the best time to visit.
Ubatuba 3-Day Forecast
Temperature Rainfall Sunshine
See the full Ubatuba climate overview or explore weather in Brazil.
Popular this month
Where to go in July - average daytime high across popular destinations.
Bucket list
Need travel inspiration? Check out our bucket list articles and be inspired.
 The 10 most alternative cities in South America
Discover South America's top 10 alternative cities! From Valparaíso's vibrant streets to La Paz's high-altitude charm and Medellín's innovative spirit.
 The 5 most tranquil retreats in the Amazon Rainforest, Brazil
Discover top sustainable lodges in the Amazon. Enjoy unique wildlife, eco-friendly stays, and immersive experiences at Anavilhanas, Cristalino, and more.
An alternative way to discover Rio de Janeiro
Don't feel like seeing the traditional tourist sights in Rio de Janeiro? We have made an overview of the sights in Rio de Janeiro that you must see if you want to visit Rio in an alternative way.
Iguazu Falls
Iguazu Falls are among the largest waterfalls on earth. You will be speechless when you see this miracle of mother nature. They are included in the World Heritage List and have also been named one of the seven wonders of the world.