Siquijor Weather & Climate: Best Time to Visit
Average temperatures, rainfall, sunshine and the best time to visit Siquijor.
Climate overview of Siquijor
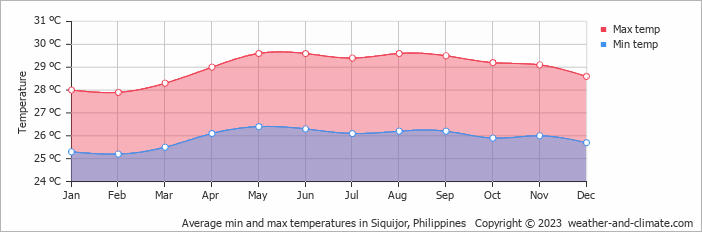
With consistently stable weather, Siquijor, Philippines, sees little seasonal temperature change. Daytime highs average 29°C (84°F), ranging from 30°C (86°F) in May to 28°C (82°F) in February.
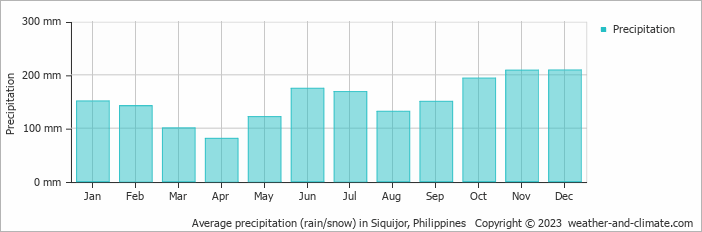
Rainfall is high, totalling around 1830 mm (72 in) per year. December is the wettest month and April the driest. The city also experiences a distinct rainy season from October to December.
Siquijor Weather by Month
Pick a month to see the average temperature, rainfall and sunshine in Siquijor - and find the best time to visit.

Monthly Temperature in Siquijor
The climate in Siquijor remains fairly constant, offering comfortable temperatures throughout the year. Average maximum daytime temperatures range from a comfortable 30°C (86°F) in May, the warmest time of the year, to a comfortable 28°C (82°F) during cooler months like February.
At night, you can expect temperatures ranging from 26°C (79°F) in May to around 25°C (77°F) during February.
Check out our detailed temperature page for more information.
Temperature ranges by month
Rainfall in Siquijor
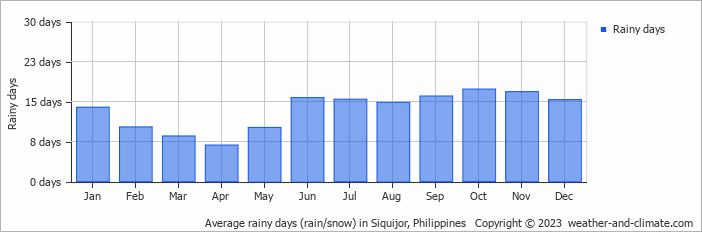
Siquijor is known for its substantial rainfall, with annual precipitation reaching 1830 mm (72 in). Significant seasonal changes in precipitation occur throughout the year. In the wettest month, December it receives heavy rainfall, averaging 209 mm (8.2 in) of precipitation, recorded across 15 rainy days. In contrast, the driest month April brings less rainfall, with 81 mm (3.2 in) over 7 rainy days. For more details, please visit our Siquijor Precipitation page.
The mean monthly precipitation over the year, including rain, hail, and snow
The average number of days each month with precipitation
Humidity in Siquijor by Month
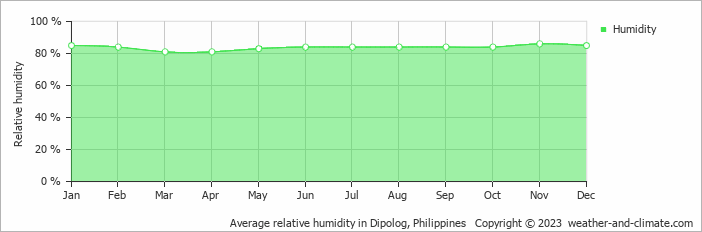
The city experiences its highest humidity in November, reaching 86%. In March, the humidity drops to its lowest level at 81%. What does this mean? Read our detailed page on humidity levels for further details.
Relative humidity over the year
Best Time to Visit Siquijor
Monthly ratings reflect general weather comfort, based on daytime temperature and rainfall. Swimming and winter conditions are highlighted separately where relevant.
- Best overall: April
- Warmest weather: March, April, May, June, July, August, September, October, November and December
- Fewest rainy days: March and April
- Seasonal pattern: A distinct rainy season from October to December
Frequently asked questions about the climate in Siquijor
What is the best time to visit Siquijor?
April typically offers the most optimal weather in Siquijor. In contrast, May, June, August, September, November and December tend to have less optimal conditions. Siquijor has a distinct rainy season from October to December.
What temperatures can I expect in Siquijor?
Daytime highs range from 28°C (82°F) in February to 30°C (86°F) in May. Nighttime lows range from 25°C (77°F) to 26°C (79°F). Temperatures stay relatively stable year-round.
How much rain does Siquijor get?
Annual rainfall is around 1830 mm (72 in). December is the wettest month with 209 mm (8.2 in), while April is the driest with 81 mm (3.2 in).
Siquijor 3-Day Forecast
Siquijor on the map
Siquijor is highlighted - select any city to see its climate.
Popular this month
Where to go in August - average daytime high across popular destinations.
 Angeles City
 31°C (88°F) Manila31°C (88°F) Cebu City31°C (88°F) Mactan
 30°C (86°F) Puerto Princesa30°C (86°F) Davao City31°C (88°F) Boracay29°C (84°F) Panglao City30°C (86°F)
















Bucket list
Need travel inspiration? Check out our bucket list articles and be inspired.
 10 Hidden gems in Asia you need to visit
Explore 10 hidden gems in Asia offering authentic experiences, from pristine beaches and remote islands to cultural treks and peaceful mountain villages.
The 10 Most Exquisite Beaches in the Philippines
Explore the top 10 breathtaking beaches in the Philippines, from serene Nacpan Beach to volcanic Camiguin Island, in our detailed guide.
Siquijor island, the island of magic, fireflies, small breathtaking bays and so much more
All the islands of the Philippines are beautiful, however Siquijor island stands out. It is the island of magic, fireflies, small breathtaking bays and so much more.
Stay at a 100% self-sustaining island resort
Coron was one of our favorite destinations in the world. The beauty of this island combined with the amazing hospitality and smiles of the Filipinos is a golden combination.