Nosara Weather & Climate: Best Time to Visit
Average temperatures, rainfall, sunshine and the best time to visit Nosara.
Climate overview of Nosara
Nosara, in Guanacaste Province, Costa Rica, maintains a steady average temperature throughout the year. The area is known for its heavy rainfall, particularly during the intense wet season months. This Pacific coast town has become a global yoga and wellness destination, where consistent surf breaks and pristine beaches attract both spiritual seekers and serious surfers. Now, let’s explore all the climate details to give you a complete picture.
Nosara Weather by Month
Pick a month to see the average temperature, rainfall and sunshine in Nosara - and find the best time to visit.

Monthly Temperature in Nosara
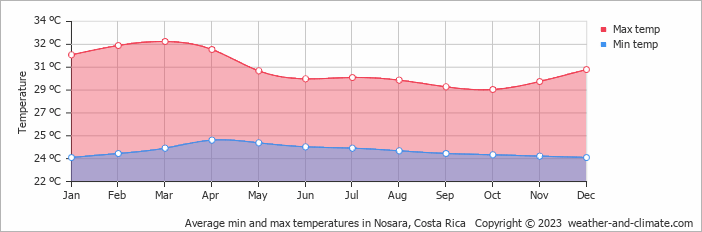
With minimal seasonal shifts, Nosara experiences a constant climate year-round. Typically, average maximum daytime temperatures range from a very warm 33°C (91°F) in March to a comfortable 29°C (84°F) in the coolest month, October.
Nights vary from 25°C (77°F) in March to around 24°C (75°F) during the colder months.
Check out our detailed temperature page for more information.
Temperature ranges by month
Rainfall in Nosara
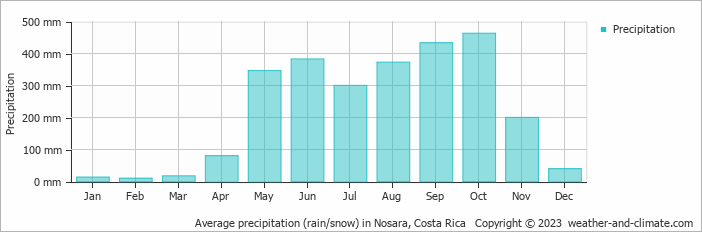
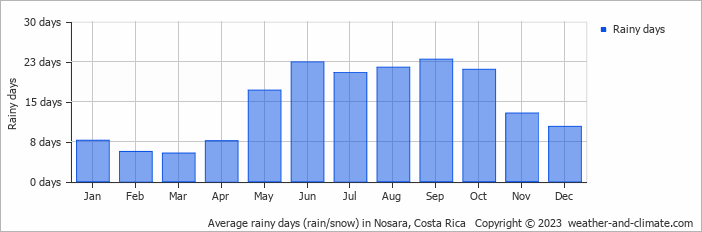
Nosara has a notably wet climate with abundant precipitation, recording 2655 mm (105 in) of rainfall per year. The climate in Nosara shows significant variation throughout the year. Expect heavy rainfall in October, the wettest month, with an average of 463 mm (18 in) of precipitation over 21 rainy days.
In contrast, the driest month February offers drier and sunnier days, with around 9.8 mm (0.4 in) of rainfall over 6 rainy days. For more details, please visit our Nosara Precipitation page.
The mean monthly precipitation over the year, including rain, hail, and snow
The average number of days each month with precipitation
Best Time to Visit Nosara
Monthly ratings reflect general weather comfort, based on daytime temperature and rainfall. Swimming and winter conditions are highlighted separately where relevant.
- Best overall: January and February
- Warmest weather: January, February, March and April
- Fewest rainy days: February and March
- Wettest months: May, June, July, August, September and October, when rainfall is highest.
- Seasonal pattern: Distinct dry (December to March) and wet (May to November) seasons
Frequently asked questions about the climate in Nosara
What is the best time to visit Nosara?
January and February typically offer the most optimal weather in Nosara. In contrast, May, June, July, August, September, October and November tend to have less optimal conditions. Nosara has distinct dry (December to March) and wet (May to November) seasons.
What temperatures can I expect in Nosara?
Daytime highs range from 29°C (84°F) in October to 33°C (91°F) in March. Nighttime lows range from 24°C (75°F) to 25°C (77°F). Temperatures stay relatively stable year-round.
How much rain does Nosara get?
Annual rainfall is around 2655 mm (105 in). October is the wettest month with 463 mm (18 in), while February is the driest with 9.8 mm (0.4 in).
Nosara 3-Day Forecast
Nosara on the map
Nosara is highlighted - select any city to see its climate.
Popular this month
Where to go in August - average daytime high across popular destinations.
 Tamarindo
 31°C (88°F) Cahuita29°C (84°F) Santa Teresa29°C (84°F) Herradura28°C (82°F) Puerto Viejo de Talamanca29°C (84°F) Fortuna28°C (82°F) Jacó28°C (82°F) San José24°C (75°F)
















Bucket list
Need travel inspiration? Check out our bucket list articles and be inspired.
Where the rain forest meets the ocean
I promise that you will not find a better location, better views, nicer rooms or lovelier staff anywhere in Costa Rica. This place really goes above and beyond.
Exploring Santa Teresa, Costa Rica: A Traveler's Guide
Immerse yourself in the laid-back charm of Santa Teresa, Costa Rica. Discover stunning beaches, vibrant dining spots, unique shops, and diverse activities in our comprehensive guide
Envision Festival
This event happens once a year in Uvita de Puntarenas and attracts people from all over the world. This festival is a must add to your bucket list.
Costa Rica Is Top Of The Happy Planet Index: Here's Why
Costa Rica has been crowned top of The Happy Planet Index — officially becoming the happiest, greenest country in the world. But what is it that makes this small but mighty Central American country so amazing?