Murud Weather & Climate: Best Time to Visit
Average temperatures, rainfall, sunshine and the best time to visit Murud.
Climate overview of Murud
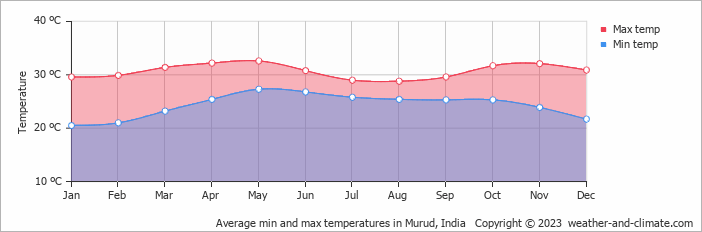
With consistently stable weather, Murud, Maharashtra, India, sees little seasonal temperature change. Daytime highs average 31°C (88°F), ranging from 33°C (91°F) in May to 29°C (84°F) in August.
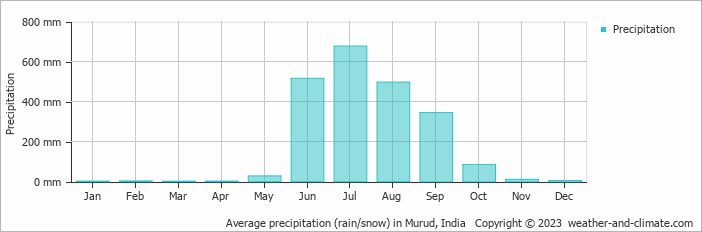
The city has a wet climate, receiving around 2161 mm (85 in) of rainfall per year. Despite the high annual total, it has distinct dry (November to May) and wet (June to September) seasons. July is the wettest month.
Murud Weather by Month
Pick a month to see the average temperature, rainfall and sunshine in Murud - and find the best time to visit.

Monthly Temperature in Murud
The climate in Murud remains fairly constant, offering very warm temperatures throughout the year. On average, daytime temperatures range from a very warm 33°C (91°F) in May to a comfortable 29°C (84°F) in August.
Nighttime temperatures range from 27°C (81°F) in May to 21°C (70°F) in August.
Check out our detailed temperature page for more information.
Temperature ranges by month
Rainfall in Murud
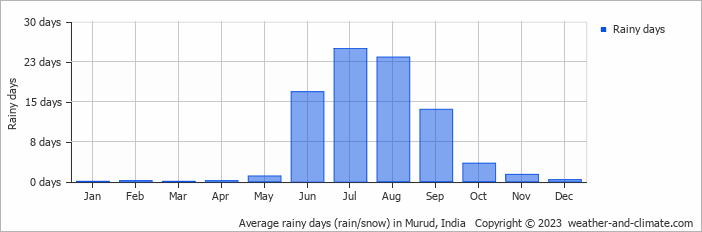
Murud is known for its substantial rainfall, with annual precipitation reaching 2161 mm (85 in). The seasons in Murud bring significant changes in precipitation. The wettest month, July, receives heavy rainfall, with an average of 676 mm (27 in) of precipitation. This rainfall is distributed across 25 rainy days.
In contrast, the driest month, March, experiences much less rainfall, totaling 0.7 mm (0.03 in) over 0 rainy days. These distinct seasonal differences provide diverse experiences throughout the year. For more details, please visit our Murud Precipitation page.
The mean monthly precipitation over the year, including rain, hail, and snow
The average number of days each month with precipitation
Best Time to Visit Murud
Monthly ratings reflect general weather comfort, based on daytime temperature and rainfall. Swimming and winter conditions are highlighted separately where relevant.
- Best overall: January, February, March, April, November and December
- Warmest weather: March, April, May, October and November
- Wettest months: June, July, August and September, when rainfall is highest.
- Seasonal pattern: Distinct dry (November to May) and wet (June to September) seasons
Frequently asked questions about the climate in Murud
What is the best time to visit Murud?
January, February, March, April, November and December typically offer the most optimal weather in Murud. In contrast, June, July, August and September tend to have less optimal conditions. Murud has distinct dry (November to May) and wet (June to September) seasons.
What temperatures can I expect in Murud?
Daytime highs range from 29°C (84°F) in August to 33°C (91°F) in May. Nighttime lows range from 21°C (70°F) to 27°C (81°F). Temperatures stay relatively stable year-round.
How much rain does Murud get?
Annual rainfall is around 2161 mm (85 in). July is the wettest month with 676 mm (27 in), while March is the driest with 0.7 mm (0.03 in).
Murud 3-Day Forecast
Murud on the map
Murud is highlighted - select any city to see its climate.
Popular this month
Where to go in August - average daytime high across popular destinations.
 Gurugram
 35°C (95°F) New Delhi34°C (93°F) Chennai
 34°C (93°F) Jaipur33°C (91°F) Hyderabad30°C (86°F) Mumbai29°C (84°F) Bengaluru
 28°C (82°F) Kochi28°C (82°F)
















Bucket list
Need travel inspiration? Check out our bucket list articles and be inspired.
A paradise called Andaman Islands
Though officially Indian, the Andamans are nearer Myanmar, Indonesia, and Thailand, resulting in amazing, budget-friendly white-sand beaches.
The 5 most beautiful monasteries in Ladakh
Explore Ladakh's spiritual essence through its incredible Buddhist monasteries. See architectural wonders, rich traditions, and serene landscapes in this guide.
Sleeping under the stars and riding camels in Rajasthan
A desert safari in Jaisalmer is definitely one of the highlights during a visit to India. Spending a night in the desert is a great adventurous bucket list experience.
Avoid mass tourism on an eco boat in the backwaters of Kerala
We can tell you now how you can avoid being surrounded by tourists and at the same time minimize your impact on the environment.