Lild Strand Sunshine Hours by Month
Sunshine plays a big role in understanding the climate of a city. This page shows the total number of hours of direct sunlight per month and the average hours per day in Lild Strand, Nordjylland, Denmark. The numbers reflect climate data gathered over a 30-year period, from 1990 to 2020.
Monthly hours of sunshine
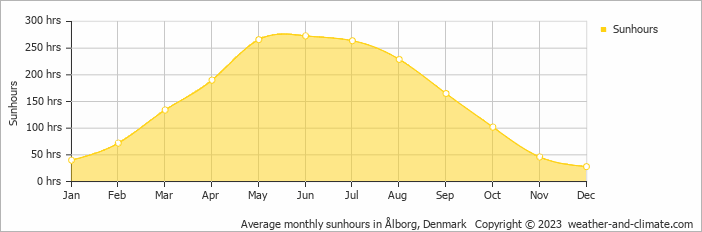
If you're visiting Lild Strand, timing is key. In June, you can enjoy up to 273 hours of sunshine, while the shorter days of December provide just 28 hours. The total annual amount of sun is 1809 hours.
Daily hours of sunshine
In Lild Strand, summer days are longer and more sunny, with daily sunshine hours peaking at 9.1 hours in June. As the darker season arrives, the brightness of the sun becomes less. December sees a soft sun for only 0.9 hours per day.
Average percent of sunshine
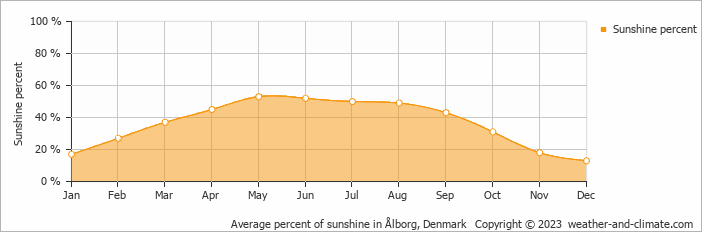
On average the sun shines 53% of the time during the day in May, the highest percentage of any month. December has the lowest percentage at 13%.
Lild Strand vs Major Cities: Sunshine Compared
Lild Strand enjoys an average of 1809 hours of sunshine annually. Let’s compare this with some popular tourist destinations:
Seville, Spain, enjoys an impressive 2920 hours of sunshine per year, making it an ideal destination even in winter.
In contrast, London, UK, receives only about 1659 hours of sunshine per year, known for its frequently overcast and rainy skies.
Meanwhile, Buenos Aires, Argentina, enjoys a humid subtropical climate with 2520 hours of sunshine annually.
In Tokyo, Japan, the average annual sunshine is 1930 hours, with sunny periods between rainy seasons.
Related Climate Data for Lild Strand
October, Lild Strand’s wettest month, receives 96 mm (3.8 in) of rainfall and has a maximum daytime temperature of 13°C (55°F). During the driest month April you can expect a temperature of 9°C (48°F).
For more detailed insights into the city’s temperatures, check out our Temperature page. To explore more about precipitation patterns, visit our Lild Strand Precipitation page.


