Al Qaşr Weather & Climate: Best Time to Visit
Average temperatures, rainfall, sunshine and the best time to visit Al Qaşr.
Climate overview of Al Qaşr
Al Qaşr, in Egypt's New Valley Governorate, experiences significant temperature changes throughout the year. Very hot summers transition to pleasant winters, while the area has desert-like conditions with almost no rainfall year-round. People come to Al Qaşr to explore one of Egypt's best-preserved medieval Islamic towns and the town is also a base for visiting nearby oases. Let's explore the climate details to provide you with a complete overview on when to visit.
Al Qaşr Weather by Month
Pick a month to see the average temperature, rainfall and sunshine in Al Qaşr - and find the best time to visit.
Monthly Temperature in Al Qaşr
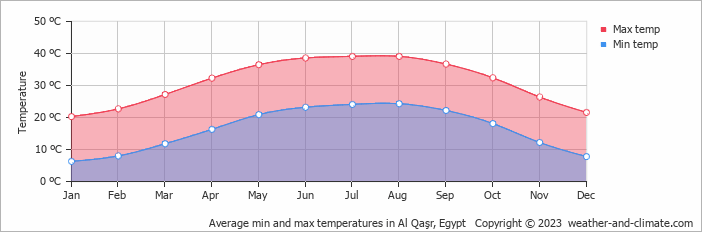
In Al Qaşr, temperatures differ significantly between summer and winter months. Typically, average maximum daytime temperatures range from a very hot 39°C (102°F) in July to a pleasant 20°C (68°F) in the coolest month, January.
Nights vary from 24°C (75°F) in July to around 6°C (43°F) during the colder months.
Check out our detailed temperature page for more information.
Temperature ranges by month
Rainfall in Al Qaşr
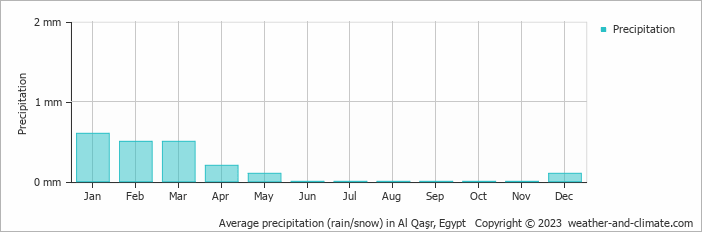
Al Qaşr sits in an arid zone with minimal moisture, averaging 2 mm (0.1 in) of rainfall per year. Precipitation levels in Al Qaşr remain relatively steady throughout the year. January has the most rain, with 0.6 mm (0.02 in) over 0 days. In the driest month June, this drops slightly to 0 mm (0 in), making the city's climate fairly predictable. For more details, please visit our Al Qaşr Precipitation page.
The mean monthly precipitation over the year, including rain, hail, and snow
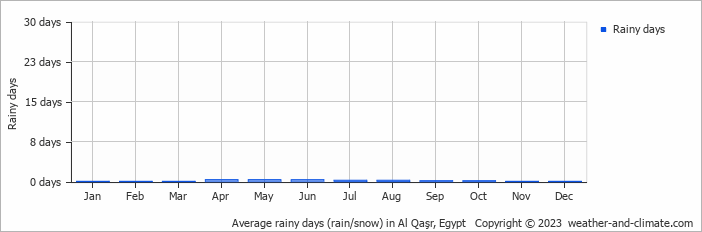
The average number of days each month with precipitation
Best Time to Visit Al Qaşr
Monthly ratings reflect general weather comfort, based on daytime temperature and rainfall. Swimming and winter conditions are highlighted separately where relevant.
- Best overall: January, February, March, November and December
- Warmest weather: June, July and August
- Seasonal pattern: Very little rainfall year-round, with very hot summers and pleasant winters
Frequently asked questions about the climate in Al Qaşr
What is the best time to visit Al Qaşr?
January, February, March, November and December typically offer the most optimal weather in Al Qaşr. In contrast, May, June, July, August and September tend to have less optimal conditions. Al Qaşr has very little rainfall year-round, with very hot summers and pleasant winters.
What temperatures can I expect in Al Qaşr?
Daytime highs range from 20°C (68°F) in January to 39°C (102°F) in July. Nighttime lows range from 6°C (43°F) to 24°C (75°F). Temperatures vary considerably through the year.
How much rain does Al Qaşr get?
Annual rainfall is around 2 mm (0.1 in). January is the wettest month with 0.6 mm (0.02 in), while June is the driest with 0 mm (0 in).
Al Qaşr 3-Day Forecast
Al Qaşr on the map
Al Qaşr is highlighted - select any city to see its climate.
Popular this month
Where to go in September - average daytime high across popular destinations.
 Luxor
Luxor 39°C (102°F) Sharm El Sheikh
 36°C (97°F) Cairo35°C (95°F) Dahab33°C (91°F) Hurghada33°C (91°F) Ain Sokhna33°C (91°F) Alexandria32°C (90°F) El Alamein31°C (88°F)















Bucket list
Need travel inspiration? Check out our bucket list articles and be inspired.
The Pyramids of Giza are impressive and absolutely worth a visit
The pyramids are considered to be one of the seven wonders of the world in ancient times and they are the only one that still exist and can be visited today.
The Sinai Peninsula: Nowhere on earth is as quiet as this place
The Sinai Peninsula has an extraordinary and enchanting landscape. The peace and space in this region is overwhelming. Nowhere on earth is as quiet as this place.
The Timeless Wonders of Luxor
Discover Luxor’s ancient marvels, from the grand Karnak temple and royal tombs of Thebes to the historic charm of the Old Winter Palace.