Hayman Island Sunshine Hours by Month
The amount of sunshine is fundamental to comprehending a place's climate. This page shows the total number of hours of direct sunlight per month and the average hours per day in Hayman Island, Australian Capital Territory, Australia. The figures are based on a 30-year period (1990–2020) to provide a reliable average.
Monthly hours of sunshine
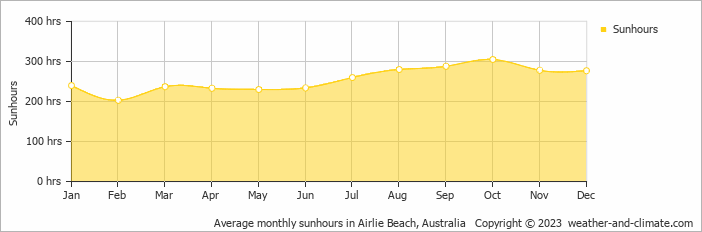
Hayman Island experiences sunny spells throughout the year. The sunniest month, October, sees up to 305 hours of sunshine, while February, the least sunny month, still provides a respectable 203 hours. The total annual sunshine amounts to 3065 hours.
Daily hours of sunshine
This means you will experience moderate variation in sunshine hours throughout the year. With 10.2 hours daily sunshine in October, it dips to 6.8 hours in February.
Hayman Island vs Major Cities: Sunshine Compared
Hayman Island enjoys an average of 3065 hours of sunshine annually. Let’s compare this with some popular tourist destinations:
Seville, Spain, enjoys an impressive 2920 hours of sunshine per year, making it an ideal destination even in winter.
In contrast, Juneau, Alaska, receives only about 1523 hours of sunshine per year and is known for its very short days in winter and frequently overcast conditions.
Toronto, Canada, sees around 2071 hours of sunshine each year, with especially long, bright summer days.
Adelaide, Australia, enjoys 2770 hours of sunshine annually, with long, sunny summers.
Related Climate Data for Hayman Island
February, Hayman Island’s wettest month, receives 244 mm (9.6 in) of rainfall and has a maximum daytime temperature of 29°C (84°F). During the driest month September you can expect a temperature of 24°C (75°F).
For more detailed insights into the city’s temperatures, check out our Temperature page. To explore more about precipitation patterns, visit our Hayman Island Precipitation page.


