Hayman Island Weather & Climate: Best Time to Visit
With consistently stable weather, Hayman Island, Australian Capital Territory, Australia, sees little seasonal temperature change. Daytime highs average 26°C (79°F), ranging from 29°C (84°F) in February to 23°C (73°F) in July.
The city has a wet climate, receiving around 1119 mm (44 in) of rainfall per year. Despite the high annual total, it has distinct dry (July to October) and wet (January to March) seasons. February is the wettest month. The sunniest month is October, with 10.2 hours of sunshine per day on average.
Monthly Temperature in Hayman Island
The climate in Hayman Island remains fairly constant, offering comfortable temperatures throughout the year. On average, daytime temperatures range from a comfortable 29°C (84°F) in February to a comfortable 23°C (73°F) in July.
Nighttime temperatures range from 26°C (79°F) in February to 20°C (68°F) in July.Check out our detailed temperature page for more information.
Temperature ranges by month

Rainfall in Hayman Island
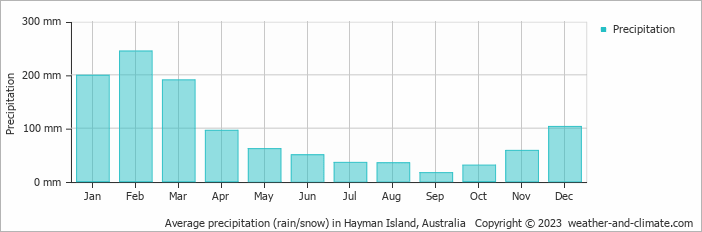
Hayman Island is known for its substantial rainfall, with annual precipitation reaching 1119 mm (44 in). The seasons in Hayman Island bring significant changes in precipitation. The wettest month, February, receives heavy rainfall, with an average of 244 mm (9.6 in) of precipitation. This rainfall is distributed across 13 rainy days.
In contrast, the driest month, September, experiences much less rainfall, totaling 16 mm (0.6 in) over 4 rainy days. These distinct seasonal differences provide diverse experiences throughout the year. For more details, please visit our Hayman Island Precipitation page.The mean monthly precipitation over the year, including rain, hail, and snow
The average number of days each month with precipitation

Sunshine Hours in Hayman Island
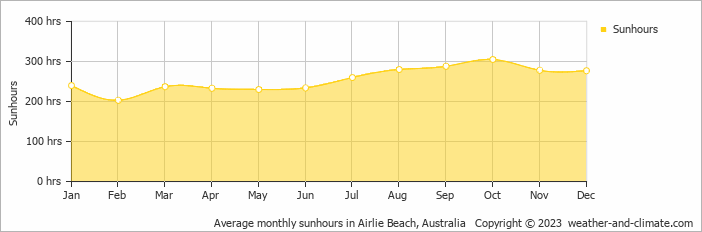
Hayman Island enjoys sunny spells year-round. October sees up to 10.2 hours of daily sunshine, perfect for a sunny trip. February, the least sunny month, still offers a generous 6.8 hours of sun despite this cloudier time of the year.
Visit our detailed sunshine hours page for more information.
Monthly hours of sunshine
Daily hours of sunshine
Humidity in Hayman Island by Month
The relative humidity is moderate throughout the year in Hayman Island.
The city experiences its highest humidity in February, reaching 67%. In June, the humidity drops to its lowest level at 51%. What does this mean? Read our detailed page on humidity levels for further details.
Relative humidity over the year

Hayman Island 3-Day Forecast
Check the conditions for any month of the year.
Best Time to Visit Hayman Island
During April, May, June, July, August, September and October, Hayman Island experiences its most favorable weather, with temperatures between 23°C (73°F) and 27°C (81°F). These mild conditions make it an excellent time for a visit.The weather does bring rainfall during this period, between 16 mm (0.6 in) and 96 mm (3.8 in).
Plan accordingly for January, February and March, when conditions bring the heaviest precipitation. Looking for inspiration on where to travel this year? We have a tool that recommends destinations based on your ideal conditions. Find out where to go with our weather planner.


