Here you can view the typical wind conditions throughout the year in Tumpat, (Kelantan), Malaysia.
Data from: Kota Bharu, Malaysia (12 KM, 7 Miles).
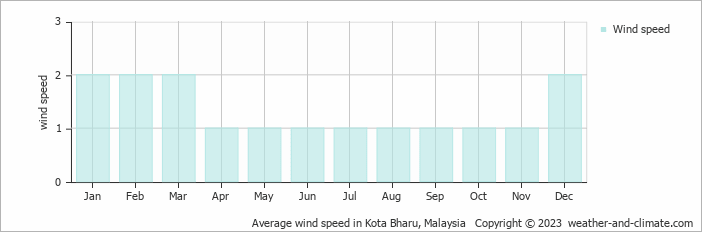
Wind speed in Tumpat varies across the year, ranging from
1 m/s (2 knots) to 2 m/s (4 knots).
The 1 m/s (2 knots) average in April, May, June, July, August, September, October and November means predominantly still conditions throughout the month. Some days will be completely calm while others may experience a bit more wind. In general this minimal wind speed is barely perceptible on skin. In terms of speed conversion, it represents 3.6 kilometers per hour or 2.2 miles per hour.
The Beaufort scale categorizes this as "light air." Smoke patterns show nearly vertical rise with slight occasional drift. Tree leaves remain generally undisturbed, with only rare gentle rustling. Wind becomes a non-factor for most activities during these tranquil months.
The windiest period, January, February, March and December has average wind speeds of 2 m/s (4 knots). This means typical days have gentle air flow that moves leaves occasionally. Wind is noticeable but not strong. The speed translates to 7.2 kilometers per hour or 4.5 miles per hour. While some days feel almost still, others may see stronger periods reaching 4 m/s (8 knots).
For more detailed information about Tumpat’s weather,
including monthly rainfall, sunshine hours, and humidity levels, visit our Tumpat climate page.




















 Sabah, one of the most biodiverse regions in Malaysia