Tumpat Weather & Climate: Best Time to Visit
Average temperatures, rainfall, sunshine and the best time to visit Tumpat.
Climate overview of Tumpat
Tumpat, Kelantan, Malaysia, enjoys a steady climate throughout the year, with daytime temperatures typically around 31°C (88°F). May is the warmest month at 32°C (90°F), while January is the coolest at 29°C (84°F).
Rainfall is high, totalling around 2396 mm (94 in) per year. December is the wettest month and February the driest. The city also experiences a distinct rainy season from September to January. Sunshine peaks in April, when the city sees around 7.2 hours of sunshine per day.
Tumpat Weather by Month
Pick a month to see the average temperature, rainfall and sunshine in Tumpat — and find the best time to visit.
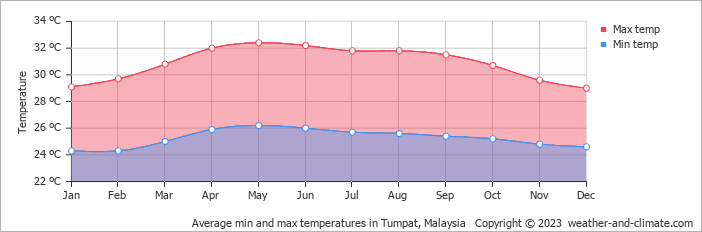
Monthly Temperature in Tumpat
The temperature in Tumpat remains steady throughout the year, providing a consistently very warm climate. Average maximum daytime temperatures range from a very warm 32°C (90°F) in May, the warmest time of the year, to a comfortable 29°C (84°F) during cooler months like January.
At night, you can expect temperatures ranging from 26°C (79°F) in May to around 24°C (75°F) during January.
Check out our detailed temperature page for more information.
Temperature ranges by month
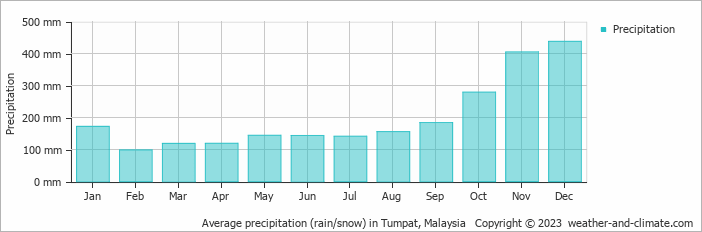
Rainfall in Tumpat
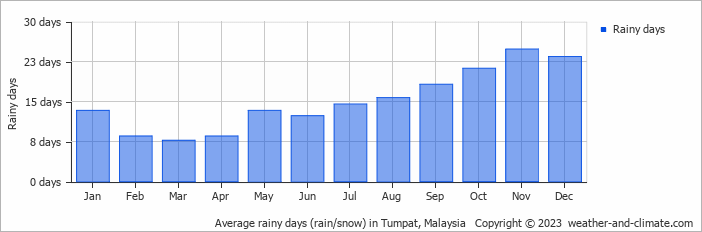
Tumpat has a relatively rainy climate with high precipitation levels, averaging 2396 mm (94 in) of rainfall annually. Significant seasonal changes in precipitation occur throughout the year. In the wettest month, December it receives heavy rainfall, averaging 438 mm (17 in) of precipitation, recorded across 23 rainy days. In contrast, the driest month February brings less rainfall, with 98 mm (3.9 in) over 9 rainy days. For more details, please visit our Tumpat Precipitation page.
The mean monthly precipitation over the year, including rain, hail, and snow
The average number of days each month with precipitation
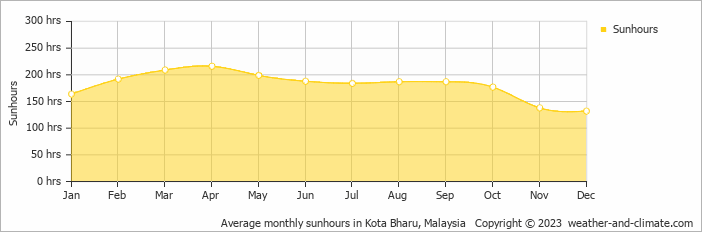
Sunshine Hours in Tumpat
While the amount of sunshine in Tumpat varies throughout the year, all seasons offer their own charm. Enjoy up to 7.2 hours of daily sun in April, and experience slightly darker atmosphere in December, with about 4.4 hours of daily sunlight.
Visit our detailed sunshine hours page for more information.
Monthly hours of sunshine
Daily hours of sunshine
Water Temperature in Tumpat
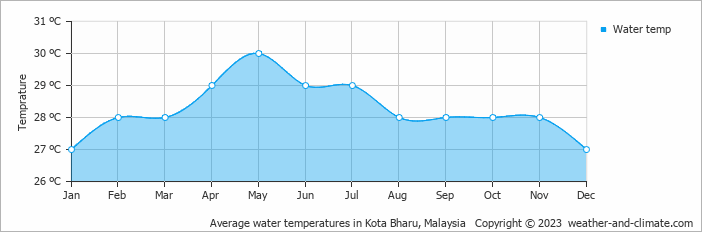
The mean water temperature over the year ranges from 27°C (81°F) in January to 30°C (86°F) in May.
Water temperature over the year
Humidity in Tumpat by Month
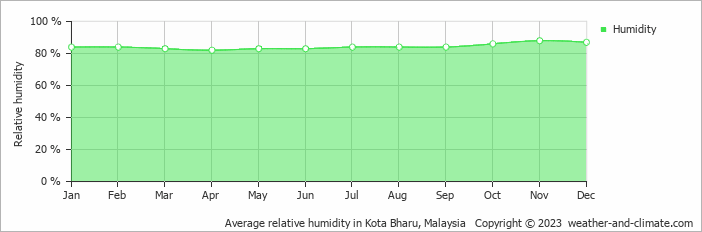
The city experiences its highest humidity in November, reaching 88%. In April, the humidity drops to its lowest level at 82%. What does this mean? Read our detailed page on humidity levels for further details.
Relative humidity over the year
Wind Speed in Tumpat
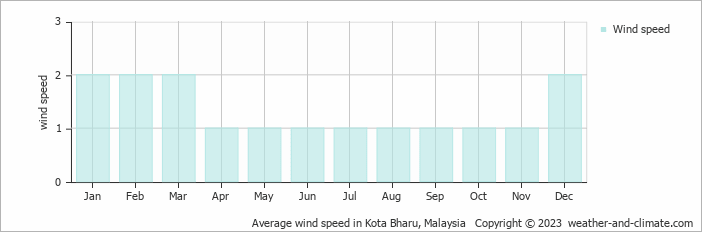
The mean wind speed varies between 1 m/s (2 knots) and 2 m/s (4 knots) throughout the year. It is lowest in April, May, June, July, August, September, October and November and highest during January, February, March and December. What does this mean?
The mean monthly wind speed over the year (meters per second)
Best Time to Visit Tumpat
For a more comfortable experience, start your day early when the weather is cooler, or take advantage of the gentle breezes in the late afternoon.
The rainy season occurs during January, September, October, November and December, when the area experiences its heaviest rainfall. Looking for inspiration on where to travel this year? We have a tool that recommends destinations based on your ideal conditions. Find out where to go with our weather planner.
Frequently asked questions about the climate in Tumpat
What is the best time to visit Tumpat?
January typically offers the most optimal weather in Tumpat. In contrast, September, October, November and December tend to have less optimal conditions. Tumpat has a distinct rainy season from September to January.
What temperatures can I expect in Tumpat?
Daytime highs range from 29°C (84°F) in January to 32°C (90°F) in May. Nighttime lows range from 24°C (75°F) to 26°C (79°F). Temperatures stay relatively stable year-round.
How much rain does Tumpat get?
Annual rainfall is around 2396 mm (94 in). December is the wettest month with 438 mm (17 in), while February is the driest with 98 mm (3.9 in).
How sunny is Tumpat?
Tumpat receives around 2,173 hours of sunshine per year. April is the sunniest month with 216 hours, while December is the cloudiest with just 132 hours. Overall, Tumpat enjoys abundant sunshine.
Tumpat 3-Day Forecast
Tumpat 3-Day Forecast
Tumpat on the map
Tumpat is highlighted — select any city to see its climate.
Popular this month
Where to go in July — average daytime high across popular destinations.
Bucket list
Need travel inspiration? Check out our bucket list articles and be inspired.
 Sabah, one of the most biodiverse regions in Malaysia
Sabah is one of the most biodiverse areas in the entire region. You will find some of the world's oldest rain forests full of rare animals and spectacular natural phenomena. For lovers of nature and wildlife this place is paradise.
Rainforest World Music Festival
The Rainforest World Music Festival (often abbreviated as RWMF) is an annual three-day music festival celebrating the diversity of world music, held in Kuching, Sarawak, Malaysia.