

















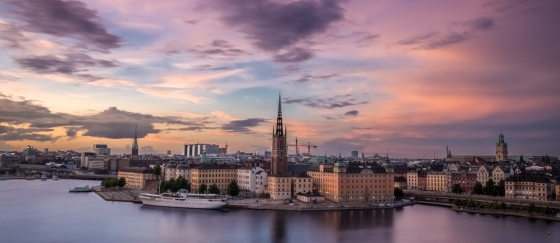
 Stockholm is one of the most beautiful cities in the world
The Swedish capital is special because of the mix of culture, nature and city. It's a city that should be on everyone's bucket list.
Here you can view the typical wind conditions throughout the year in Sundbyberg, (Stockholm county), Sweden.
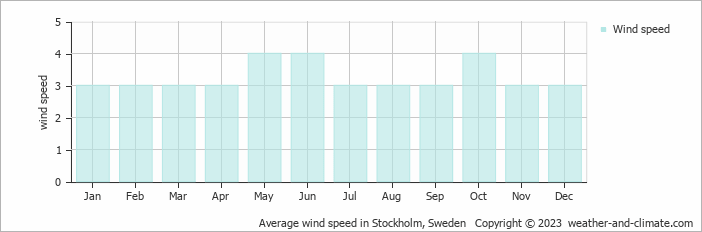
Throughout the year, wind speeds in Sundbyberg average from 3 m/s (6 knots) and increase to 4 m/s (8 knots).
The 3 m/s (6 knots) average wind speed in January, February, March, April, July, August, September, November and December brings moderate air movement. Conditions can vary throughout the month, with some days experiencing stronger winds and others remaining calm. At this average speed, leaves and small branches move steadily, and flags show continuous motion. This equates to about 11 kilometers per hour or 6.7 miles per hour.
Wind speeds average 4 m/s (8 knots) during May, June and October; these fall in the windiest period. This means most days are noticeably windy with small branches moving constantly. Dust gets lifted and papers blow around. The measurement represents 14.4 km/h or 8.9 mph. There may still be stronger gusts or calmer moments, but breezy conditions are typical.
For more detailed information about Sundbyberg’s weather, including monthly rainfall, sunshine hours, and humidity levels, visit our Sundbyberg climate page.
Pick a month to see the average temperature, rainfall and sunshine in Sundbyberg - and find the best time to visit.
Temperature Rainfall Sunshine Humidity Wind Speed Water Temp
See the full Sundbyberg climate overview or explore weather in Sweden.
Where to go in September - average daytime high across popular destinations.
Lund 18°C (64°F) Malmö19°C (66°F) Gothenburg
 18°C (64°F) Karlskrona17°C (63°F) Falkenberg18°C (64°F) Simrishamn17°C (63°F) Stockholm17°C (63°F) Visby
 17°C (63°F)
 Need travel inspiration? Check out our bucket list articles and be inspired.
Stockholm is one of the most beautiful cities in the world
The Swedish capital is special because of the mix of culture, nature and city. It's a city that should be on everyone's bucket list.
 Nordic skating in Sweden
In between the snowy hills and dense pine forests you will find an innumerable amount of lakes in Sweden, large and small ones on which you can skate wonderfully.
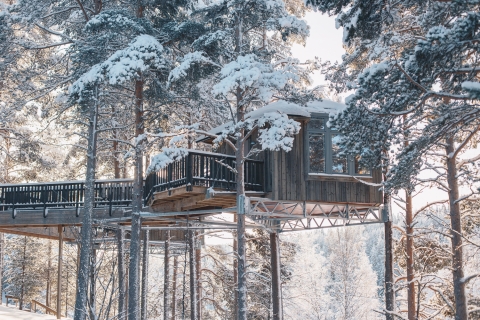 Sleep among the trees in Sweden
If you are looking for a tranquil retreat in Swedish Lapland we recommend to stay at Granó Beckasin. It has a fantastic location on the Ume river where you will experience silence and tranquility.
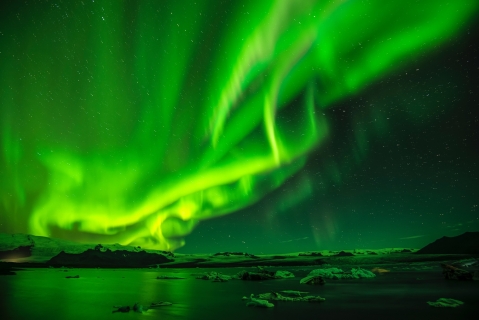
 See the northern lights
The northern lights, polar light or Aarora Borealis is a true spectacle of nature! Green, sometimes purple, red and yellow streaks of light colors the dark skies.