Average monthly wind speed in Herning
On this page you will find more information about the mean monthly wind speed over the year in Herning (Midtjylland), Denmark.
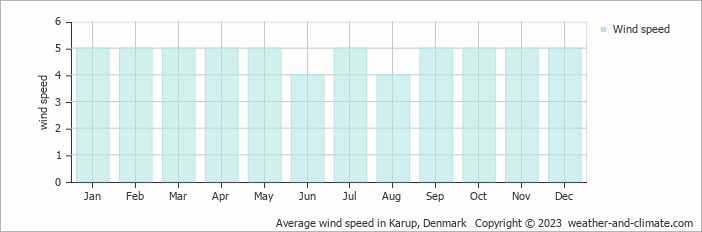
Annually, wind speeds in Herning vary between 4 m/s (8 knots) at their lowest and 5 m/s (10 knots) at their peak.
In June and August you will have an average wind speed of 4 m/s (8 knots), indicating a noticeable breeze on most days. Daily variations can range from very light winds to stronger gusts. On an average day with 4 m/s (8 knots), small tree branches sway steadily. This speed is equivalent to 14.4 kilometers per hour or 8.9 miles per hour. While the climate generally allows for outdoor activities, occasional gusts may affect activities such as ball games. It can also produce white-capped waves over water.
Wind speeds average 5 m/s (10 knots) in , marking the windiest months of the year. The air is often steady and noticeable throughout the month, though occasional stronger gusts or brief calms may occur. Windy conditions are typical during this period, making it a great time for activities like windsurfing and kitesurfing.
For more detailed information about Herning’s weather, including monthly rainfall, sunshine hours, and humidity levels, visit our Herning climate page.


