
















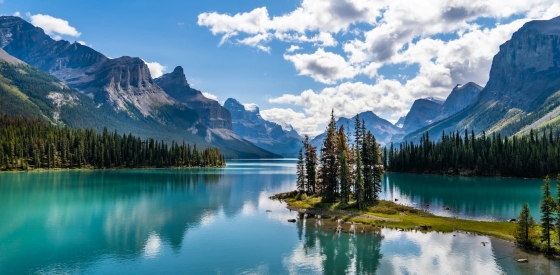
 The 5 most beautiful lakes in Canada
Explore Canada's stunning lakes: Lake Louise, Lake Superior, Maligne Lake, Emerald Lake, and Lake Okanagan, each offering unique beauty and activities.
On this page you will find more information about the mean monthly wind speed over the year in Kuujjuanq (), Canada.
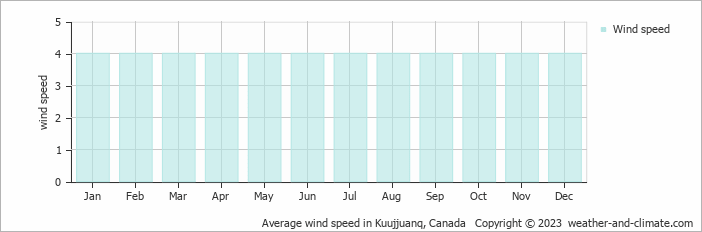
Wind speed in Kuujjuanq varies across the year, ranging from 4 m/s (8 knots) to 4 m/s (8 knots).
In January, February, March, April, May, June, July, August, September, October, November and December you will have an average wind speed of 4 m/s (8 knots), indicating a noticeable breeze on most days. Daily variations can range from very light winds to stronger gusts. On an average day with 4 m/s (8 knots), small tree branches sway steadily. This speed is equivalent to 14.4 kilometers per hour or 8.9 miles per hour. While the climate generally allows for outdoor activities, occasional gusts may affect activities such as ball games. It can also produce white-capped waves over water.
For more detailed information about Kuujjuanq’s weather, including monthly rainfall, sunshine hours, and humidity levels, visit our Kuujjuanq climate page.
Pick a month to see the average temperature, rainfall and sunshine in Kuujjuanq - and find the best time to visit.
Temperature Rainfall Sunshine Humidity Wind Speed
See the full Kuujjuanq climate overview or explore weather in Canada.
Where to go in October - average daytime high across popular destinations.
Toronto 16°C (61°F) Niagara Falls15°C (59°F) Montréal14°C (57°F) Ottawa14°C (57°F) Vancouver
 14°C (57°F) Quebec City12°C (54°F) Calgary
 12°C (54°F) Whistler7°C (45°F)
 Need travel inspiration? Check out our bucket list articles and be inspired.
The 5 most beautiful lakes in Canada
Explore Canada's stunning lakes: Lake Louise, Lake Superior, Maligne Lake, Emerald Lake, and Lake Okanagan, each offering unique beauty and activities.
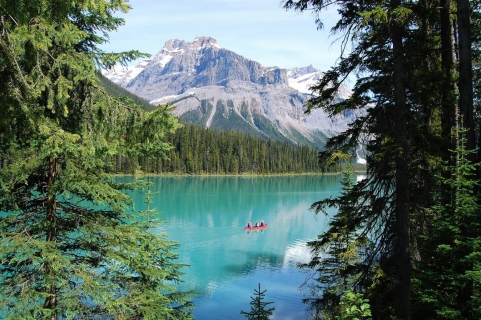 Canada in September: Where Is the Best Weather?
Compare September weather in Toronto, Montreal, Vancouver, Quebec City and Osoyoos to find Canada's warmest, driest and sunniest destinations.
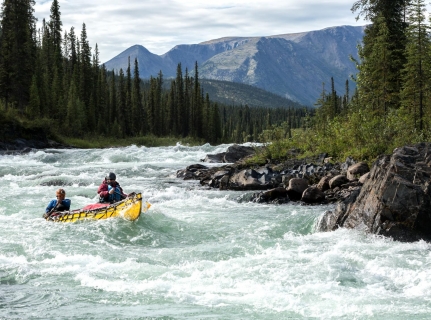 Canoeing the south Nahannii
The South Nahanni in the northwest of Canada is one of the most impressive wilderness rivers in the world. Canoeing the south Nahanni is something you must add to your bucket list.
 See Polar Bears in Churchill Canada
Thousands of bears gather at the small town of Churchill. In the evening the northern lights give a light show against the dark evening sky. An unforgettable experience.