Kuujjuanq Weather & Climate: Best Time to Visit
Average temperatures, rainfall, sunshine and the best time to visit Kuujjuanq.
Climate overview of Kuujjuanq
Kuujjuanq, Canada, experiences significant temperature variation throughout the year. Summers bring daytime highs of 18°C (64°F) in July, while winters cool to -19°C (-2°F) in February.
Annual rain/snowfall is moderate at around 639 mm (25 in), with September being the wettest month. The city also has a distinct dry season from December to April. The sunniest month is July, with 6.9 hours of sunshine per day on average.
Kuujjuanq Weather by Month
Pick a month to see the average temperature, rainfall and sunshine in Kuujjuanq — and find the best time to visit.
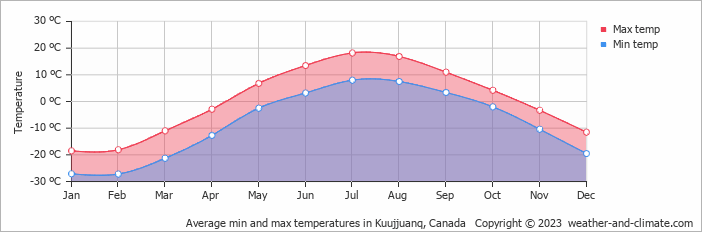
Monthly Temperature in Kuujjuanq
Depending on the time of the year, temperatures range from pleasant to very cold in Kuujjuanq. Average daytime temperatures reach a pleasant 18°C (64°F) in July. In February, the coolest month of the year, temperatures drop to a very cold -19°C (-2°F).
At night, temperatures range from around 8°C (46°F) in July to -27°C (-17°F) in February.
Check out our detailed temperature page for more information.
Temperature ranges by month
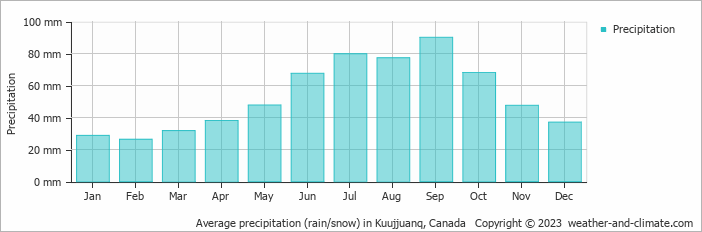
Rainfall in Kuujjuanq
Generally, Kuujjuanq has a moderate amount of precipitation, averaging 639 mm (25 in) of rain/snowfall annually. Kuujjuanq can be quite wet during September, receiving approximately 90 mm (3.5 in) of precipitation over 16 rainy days.
In contrast, during the driest month (February), you will experience much drier conditions, with 26 mm (1 in) of precipitation spread across 13 snowy days days. For more details, please visit our Kuujjuanq Precipitation page.
The mean monthly precipitation over the year, including rain, hail, and snow
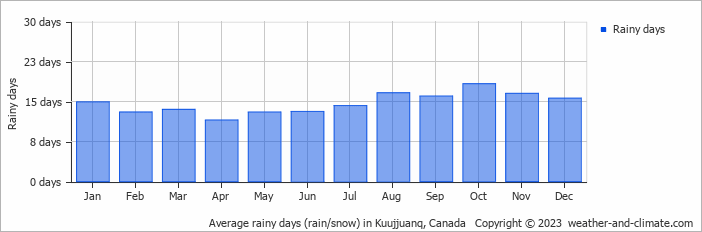
The average number of days each month with precipitation
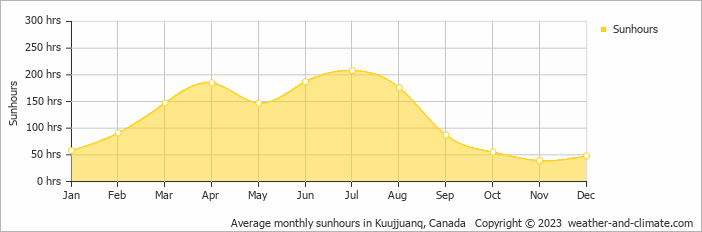
Sunshine Hours in Kuujjuanq
Kuujjuanq can be enjoyed more throughout the sunniest month of July under a blue sky, with approximately 6.9 hours of sunshine daily. In contrast, the city experiences much darker days in November, with only 1.3 hours of sunlight per day.
Visit our detailed sunshine hours page for more information.
Monthly hours of sunshine
Daily hours of sunshine
Daily percentage of sunshine
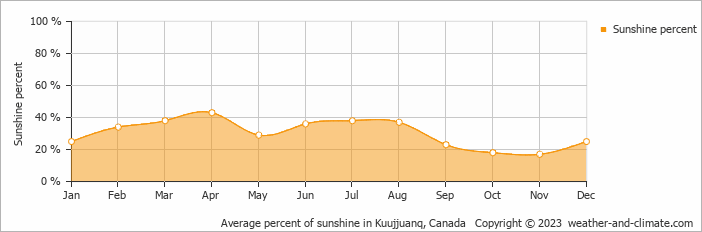
Humidity in Kuujjuanq by Month
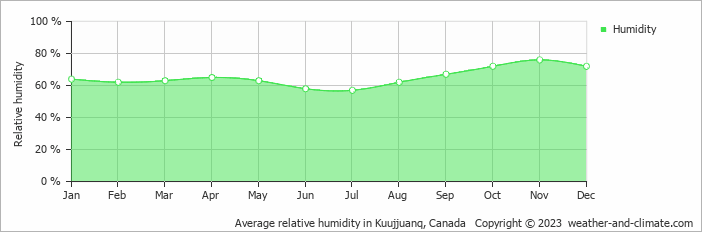
The relative humidity is high throughout the year in Kuujjuanq.
The city experiences its highest humidity in November, reaching 76%. In July, the humidity drops to its lowest level at 57%. What does this mean? Read our detailed page on humidity levels for further details.
Relative humidity over the year
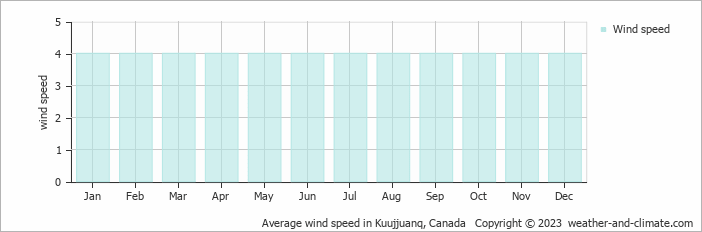
Wind Speed in Kuujjuanq
The mean wind speed varies between 4 m/s (8 knots) and 4 m/s (8 knots) throughout the year. It is lowest in January, February, March, April, May, June, July, August, September, October, November and December and highest during January, February, March, April, May, June, July, August, September, October, November and December. What does this mean?
The mean monthly wind speed over the year (meters per second)
Best Time to Visit Kuujjuanq
Rainfall during this time ranges from 77 mm (3 in) in August to 80 mm (3.1 in) in July. This means you can expect a mix of sunny days and occasional showers. Ready to plan your travels but need destination ideas? Our smart tool recommends places based on the climate conditions you prefer. Start planning with our destination weather tool.
Frequently asked questions about the climate in Kuujjuanq
What is the best time to visit Kuujjuanq?
July typically offers the most optimal weather in Kuujjuanq. In contrast, January, February, March, April, May, October, November and December tend to have less optimal conditions. Kuujjuanq has a distinct dry season from December to April.
What temperatures can I expect in Kuujjuanq?
Daytime highs range from -19°C (-2°F) in February to 18°C (64°F) in July. Nighttime lows range from -27°C (-17°F) to 8°C (46°F). Temperatures vary considerably through the year.
How much rain does Kuujjuanq get?
Annual rainfall is around 639 mm (25 in). September is the wettest month with 90 mm (3.5 in), while February is the driest with 26 mm (1 in).
How sunny is Kuujjuanq?
Kuujjuanq receives around 1,428 hours of sunshine per year. July is the sunniest month with 208 hours, while November is the cloudiest with just 39 hours.
Kuujjuanq 3-Day Forecast
Kuujjuanq 3-Day Forecast
Kuujjuanq on the map
Kuujjuanq is highlighted — select any city to see its climate.
Popular this month
Where to go in July — average daytime high across popular destinations.
Bucket list
Need travel inspiration? Check out our bucket list articles and be inspired.
 The 5 most beautiful lakes in Canada
Explore Canada's stunning lakes: Lake Louise, Lake Superior, Maligne Lake, Emerald Lake, and Lake Okanagan, each offering unique beauty and activities.
Canoeing the south Nahannii
The South Nahanni in the northwest of Canada is one of the most impressive wilderness rivers in the world. Canoeing the south Nahanni is something you must add to your bucket list.
See Polar Bears in Churchill Canada
Thousands of bears gather at the small town of Churchill. In the evening the northern lights give a light show against the dark evening sky. An unforgettable experience.
Banff National Park
Snowy mountains, clear blue lakes and green forests make Banff National Park a wonderful bucket list destination. The pristine wilderness is a mecca for walkers.