Waterberg Weather and Climate: A Comprehensive Guide
Temperatures see a moderate degree of fluctuation,
transitioning from very warm conditions
to warm.
It receives a reasonable amount of rainfall.
Let's now guide you through the climate details for a complete overview.
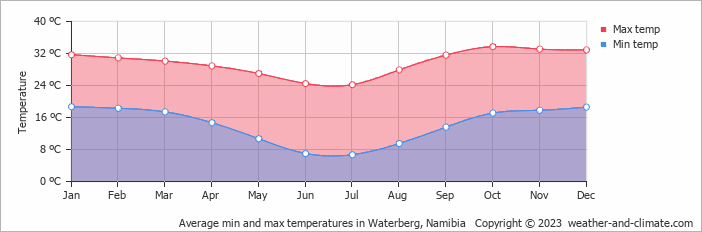
Average maximum day and minimum night temperature
In Waterberg, seasonal changes bring about a moderate variation in temperatures. Average daytime temperatures reach a very warm 34°C in October. In July, the coolest month of the year, temperatures drop to a comfortable 24°C.
At night, you can expect cooler temperatures, with averages dropping to around 7°C during this month.Check out our detailed temperature page for more information.
Temperature ranges by month
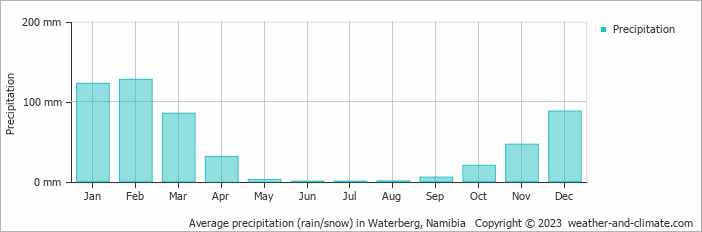
Precipitation and rainy days
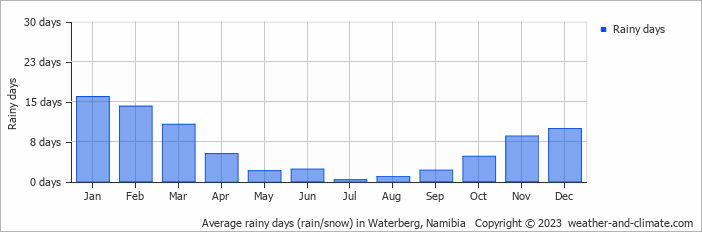
Generally, Waterberg experiences moderate precipitation patterns, averaging 529 mm yearly. Waterberg can be quite wet during February, receiving approximately 128 mm of precipitation over 14 rainy days.
In contrast June, experiences much drier conditions, with 0.2 mm of rainfall, spread across 2 rainy days. For more details, please visit our Waterberg Precipitation page.The mean monthly precipitation over the year, including rain, hail and snow
The average number of days each month with precipitation
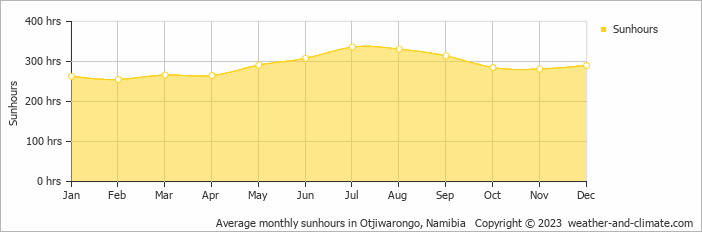
Sunshine over the year
Waterberg experiences moderate variation in sunshine hours across the seasons. With 11.2 hours daily sunshine in July, it dips to 8.5 hours in February, offering a balanced mix of sunny and overcast days.
Visit our detailed sunshine hours page for more information.
Monthly hours of sunshine
Daily hours of sunshine
Forecast for Waterberg


Select a Month of Interest
Check the conditions for any month of the year.
The best time of year to visit Waterberg in Namibia
During the months of June and July you are most likely to experience good weather with pleasant average temperatures that fall between 20°C and 26°C.Other facts from our historical weather data:
Yes, the months of May, June, July, August, September and October are very dry.
October has an average maximum temperature of 34°C and is the warmest month of the year.
The coldest month is July with an average maximum temperature of 24°C.
February tops the wettest month list with 128 mm of rainfall.
July is the driest month with 0 mm of precipitation.
July is the sunniest month with an average of 336 hours of sunshine.
No idea where to travel to this year? We have a tool that recommends destinations based on your ideal conditions. Find out where to go with our weather planner.


