Vyborg Weather & Climate: Best Time to Visit
Average temperatures, rainfall, sunshine and the best time to visit Vyborg.
Climate overview of Vyborg
Vyborg, Leningrad Region, Russia, experiences significant temperature variation throughout the year. Summers bring daytime highs of 23°C (73°F) in July, while winters cool to -3°C (27°F) in February.
The city receives around 753 mm (30 in) of rain/snowfall per year. August is the wettest month and April the driest.
Vyborg Weather by Month
Pick a month to see the average temperature, rainfall and sunshine in Vyborg — and find the best time to visit.
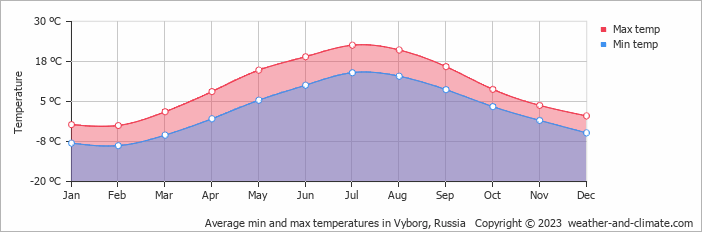
Monthly Temperature in Vyborg
Depending on the time of the year, temperatures range from comfortable to very cold in Vyborg. On average, daytime temperatures range from a comfortable 23°C (73°F) in July to a very cold -3°C (27°F) in February.
Nighttime temperatures range from 14°C (57°F) in July to -9°C (16°F) in February.
Check out our detailed temperature page for more information.
Temperature ranges by month
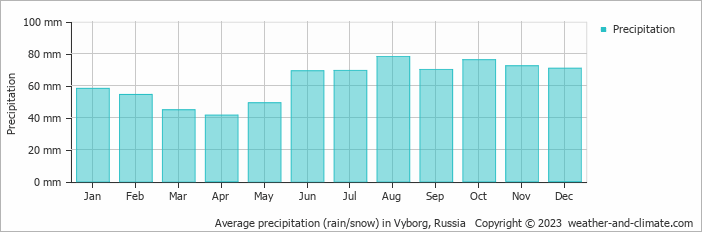
Rainfall in Vyborg
Generally, Vyborg has a moderate amount of precipitation, averaging 753 mm (30 in) of rain/snowfall annually. The amount of precipitation varies moderately throughout the year. The wettest month, August, sees around 78 mm (3.1 in) of rainfall, perfect for those who enjoy a bit of rain now and then. The driest month, April, still receives a respectable 41 mm (1.6 in) of rainfall. For more details, please visit our Vyborg Precipitation page.
The mean monthly precipitation over the year, including rain, hail, and snow
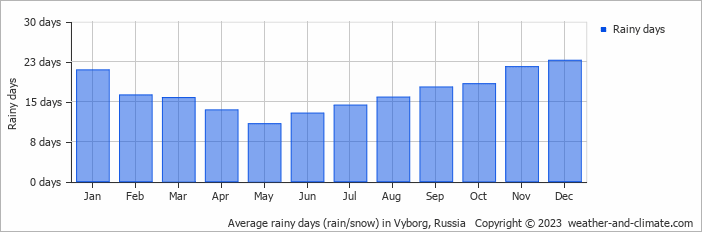
The average number of days each month with precipitation
Best Time to Visit Vyborg
Rainfall during this time ranges from 69 mm (2.7 in) in June to 78 mm (3.1 in) in August. This means you can expect a mix of sunny days and occasional showers. Need help choosing your next travel destination? We offer a specialized tool that matches you with locations based on your weather preferences. Explore destinations that suit your climate preferences.
Frequently asked questions about the climate in Vyborg
What is the best time to visit Vyborg?
July and August typically offer the most optimal weather in Vyborg. In contrast, January, February, March, April, October, November and December tend to have less optimal conditions.
What temperatures can I expect in Vyborg?
Daytime highs range from -3°C (27°F) in February to 23°C (73°F) in July. Nighttime lows range from -9°C (16°F) to 14°C (57°F). Temperatures vary considerably through the year.
How much rain does Vyborg get?
Annual rainfall is around 753 mm (30 in). August is the wettest month with 78 mm (3.1 in), while April is the driest with 41 mm (1.6 in).
Vyborg 3-Day Forecast
Vyborg 3-Day Forecast
Vyborg on the map
Vyborg is highlighted — select any city to see its climate.
Popular this month
Where to go in July — average daytime high across popular destinations.
Bucket list
Need travel inspiration? Check out our bucket list articles and be inspired.
 Visit the Kamchatka Peninsula
One of the most enchanting areas of Russia is the Kamchatka peninsula. It is how the earth must have looked like in prehistoric times.
Be amazed by the Altai mountains
The Atlai mountains are a sparsely populated area that most tourists have not yet discovered. Definitely bucket list material for the adventurous travelers among us.