Vordingborg Weather & Climate: Best Time to Visit
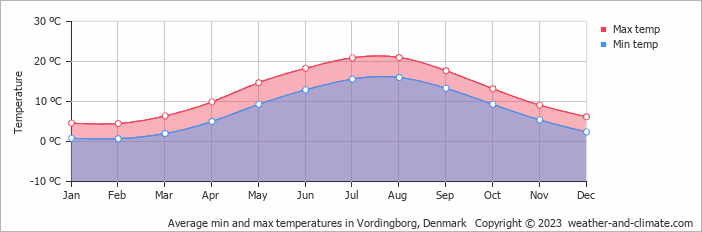
Vordingborg, Region Sjælland, Denmark, sees big temperature differences between seasons, with August peaking at 21°C (70°F) and February dropping to 5°C (41°F).
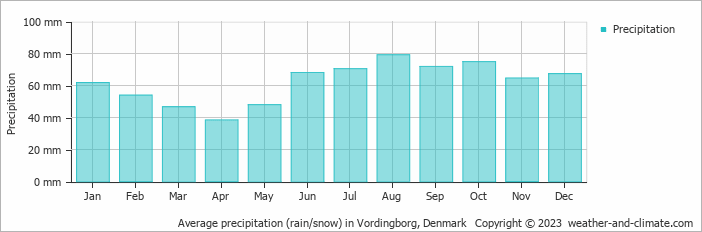
Vordingborg sees a moderate amount of rain/snowfall, totalling around 745 mm (29 in) per year.
Monthly Temperature in Vordingborg
Visitors to Vordingborg can expect significant temperature changes throughout the year. Average maximum daytime temperatures range from a pleasant 21°C (70°F) in August, the warmest time of the year, to a chilly 5°C (41°F) during cooler months like February.
At night, you can expect temperatures ranging from 16°C (61°F) in August to around 1°C (34°F) during February.
Check out our detailed temperature page for more information.
Temperature ranges by month
Rainfall in Vordingborg
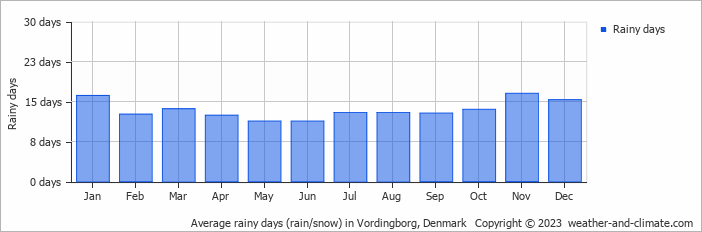
Generally, Vordingborg experiences moderate precipitation patterns, averaging 745 mm (29 in) yearly. While rainfall varies throughout the year, each season offers its own charm. August brings wetter days averaging 79 mm (3.1 in) of precipitation, spread over 13 rainy days.
In contrast, the driest month April experiences a drier climate, with about 38 mm (1.5 in) of rainfall spread across 12 rainy days. For more details, please visit our Vordingborg Precipitation page.
The mean monthly precipitation over the year, including rain, hail, and snow
The average number of days each month with precipitation
Vordingborg 3-Day Forecast
Check the conditions for any month of the year.
Best Time to Visit Vordingborg
During June, July and August, Vordingborg experiences its most favorable weather, with temperatures between 18°C (65°F) and 21°C (70°F). These mild conditions make it an excellent time for a visit.The weather does bring rainfall during this period, between 68 mm (2.7 in) and 79 mm (3.1 in). Seeking the perfect travel destination for this year? We've created a tool that suggests locations matching your desired weather. Let our weather planner guide your travel decisions.


