Volčja Draga Weather & Climate: Best Time to Visit
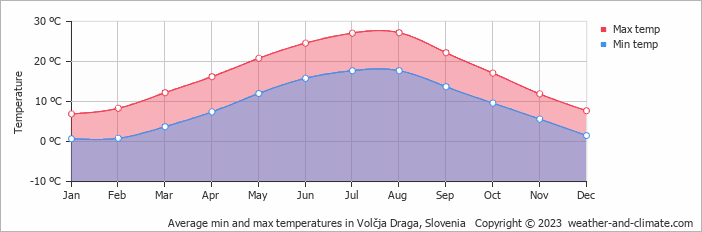
Volčja Draga, Slovenia, sees big temperature differences between seasons, with August peaking at 27°C (81°F) and January dropping to 7°C (45°F).
The city has a wet climate, receiving around 1693 mm (67 in) of rain/snowfall per year. Despite the high annual total, it has a distinct rainy season from September to November. November is the wettest month. The sunniest month is July, with 9.7 hours of sunshine per day on average.
Monthly Temperature in Volčja Draga
Visitors to Volčja Draga can expect significant temperature changes throughout the year. On average, daytime temperatures range from a comfortable 27°C (81°F) in August to a chilly 7°C (45°F) in January.
Nighttime temperatures range from 18°C (64°F) in August to 1°C (34°F) in January.
Check out our detailed temperature page for more information.
Temperature ranges by month
Rainfall in Volčja Draga
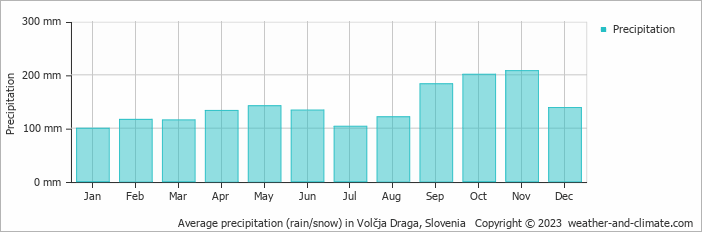
Volčja Draga is known for its substantial rain/snowfall, with annual precipitation reaching 1693 mm (67 in). The amount of precipitation varies moderately throughout the year. The wettest month, November, sees around 208 mm (8.2 in) of rainfall, perfect for those who enjoy a bit of rain now and then. The driest month, January, still receives a respectable 100 mm (3.9 in) of rainfall. For more details, please visit our Volčja Draga Precipitation page.
The mean monthly precipitation over the year, including rain, hail, and snow
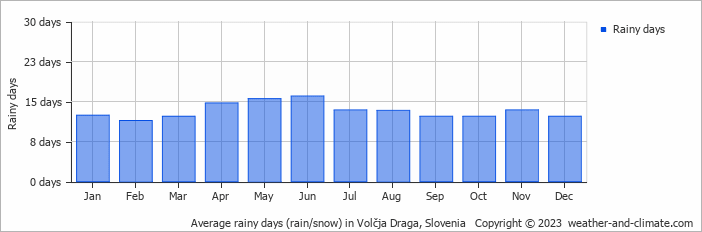
The average number of days each month with precipitation
Sunshine Hours in Volčja Draga
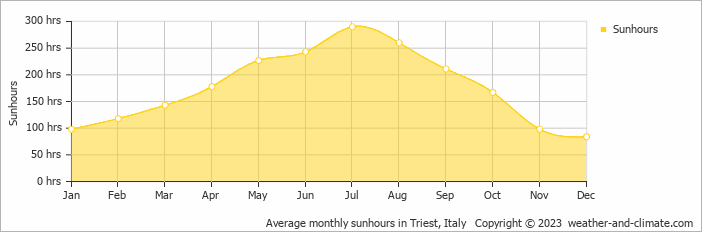
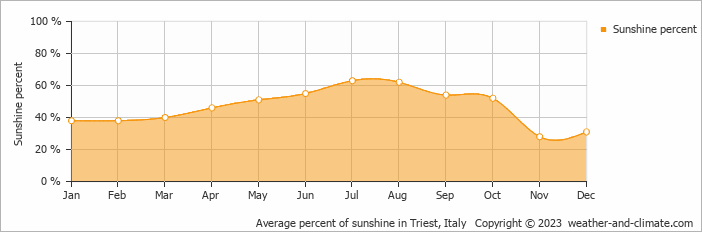
In Volčja Draga, summer days are longer and more sunny, with daily sunshine hours peaking at 9.7 hours in July. As the darker season arrives, the brightness of the sun becomes less. December sees a soft sun for only 2.8 hours per average day.
Visit our detailed sunshine hours page for more information.
Monthly hours of sunshine
Daily hours of sunshine
Daily percentage of sunshine
Humidity in Volčja Draga by Month
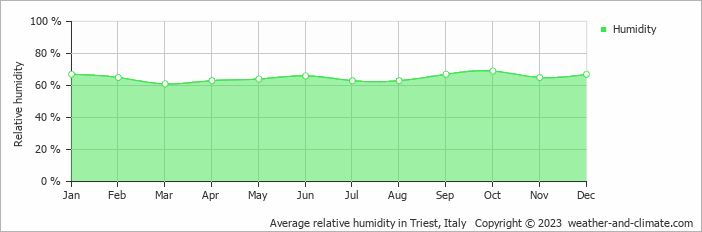
The relative humidity is high throughout the year in Volčja Draga.
The city experiences its highest humidity in October, reaching 69%. In March, the humidity drops to its lowest level at 61%. What does this mean? Read our detailed page on humidity levels for further details.
Relative humidity over the year
Volčja Draga 3-Day Forecast
Check the conditions for any month of the year.
Best Time to Visit Volčja Draga
During May, June, July and August, Volčja Draga experiences its most favorable weather, with temperatures between 21°C (69°F) and 27°C (81°F). These mild conditions make it an excellent time for a visit.The weather does bring rainfall during this period, between 103 mm (4.1 in) and 142 mm (5.6 in).
Plan accordingly for September, October and November, when conditions bring the heaviest precipitation. Need help choosing your next travel destination? We offer a specialized tool that matches you with locations based on your weather preferences. Explore destinations that suit your climate preferences.


