Vodnjan Weather & Climate: Best Time to Visit
The climate in Vodnjan, Istria, Croatia, is marked by large temperature swings across the seasons, ranging from 28°C (82°F) in August to 10°C (50°F) in February.
The city has a wet climate, receiving around 1196 mm (47 in) of rainfall per year. November is the wettest month. Sunshine peaks in July, when the city sees around 10.0 hours of sunshine per day.
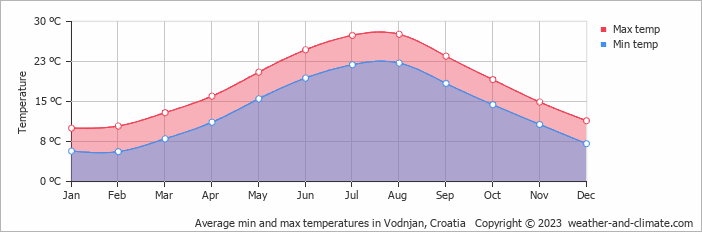
Monthly Temperature in Vodnjan
In Vodnjan, temperatures differ significantly between summer and winter months. On average, daytime temperatures range from a comfortable 28°C (82°F) in August to a chilly 10°C (50°F) in February.
Nighttime temperatures range from 22°C (72°F) in August to 6°C (43°F) in February.
Check out our detailed temperature page for more information.
Temperature ranges by month
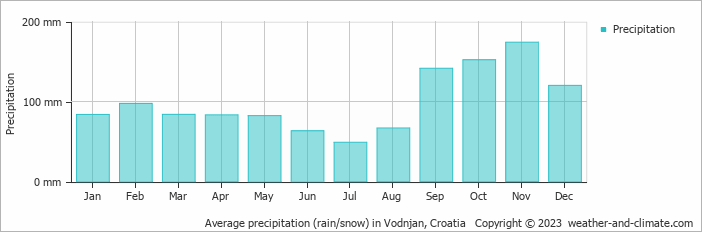
Rainfall in Vodnjan
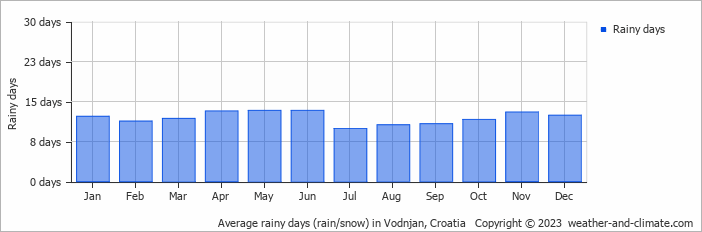
Vodnjan experiences significant rainfall throughout the year, averaging 1196 mm (47 in) of precipitation annually. The seasons in Vodnjan bring significant changes in precipitation. The wettest month, November, receives heavy rainfall, with an average of 174 mm (6.9 in) of precipitation. This rainfall is distributed across 13 rainy days.
In contrast, the driest month, July, experiences much less rainfall, totaling 49 mm (1.9 in) over 10 rainy days. These distinct seasonal differences provide diverse experiences throughout the year. For more details, please visit our Vodnjan Precipitation page.
The mean monthly precipitation over the year, including rain, hail, and snow
The average number of days each month with precipitation
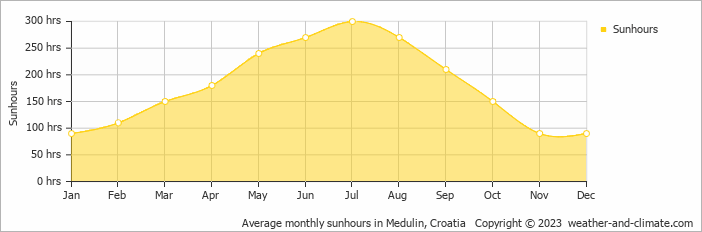
Sunshine Hours in Vodnjan
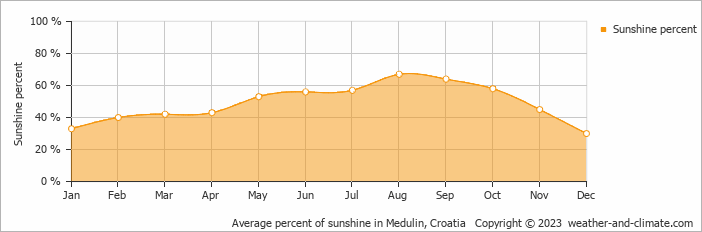
In Vodnjan, summer days are longer and more sunny, with daily sunshine hours peaking at 10.0 hours in July. As the darker season arrives, the brightness of the sun becomes less. January sees a soft sun for only 3.0 hours per average day.
Visit our detailed sunshine hours page for more information.
Monthly hours of sunshine
Daily hours of sunshine
Daily percentage of sunshine
Water Temperature in Vodnjan
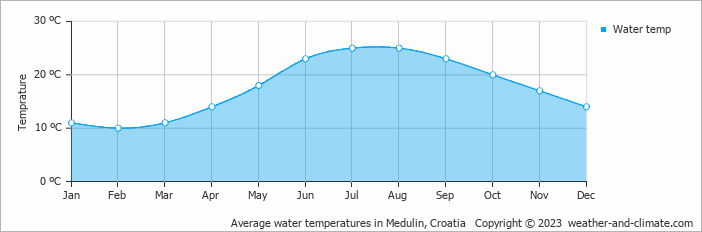
The mean water temperature over the year ranges from 10°C (50°F) in February to 25°C (77°F) in July.
Water temperature over the year
Vodnjan 3-Day Forecast
Check the conditions for any month of the year.
Best Time to Visit Vodnjan
The best time to visit Vodnjan is during May, June, July, August and September, when the weather provides comfortable temperatures between 21°C (69°F) and 28°C (82°F). With rainfall of 49 mm (1.9 in) to 141 mm (5.6 in), you can expect pleasant weather during your visit in these months.Be prepared for heavier rainfall during November, the wettest period of the year. Need help choosing your next travel destination? We offer a specialized tool that matches you with locations based on your weather preferences. Explore destinations that suit your climate preferences.


