Climate ▸Forecast ▸March ▸May ▸
JanuaryFebruaryMarchAprilMayJuneJulyAugustSeptemberOctoberNovemberDecember

Average water temperature in Vodnjan

On this page you find the mean water temperature over the year in Vodnjan (Istria), Croatia. Discover when the water is at its warmest and coolest, perfect for planning your visit.

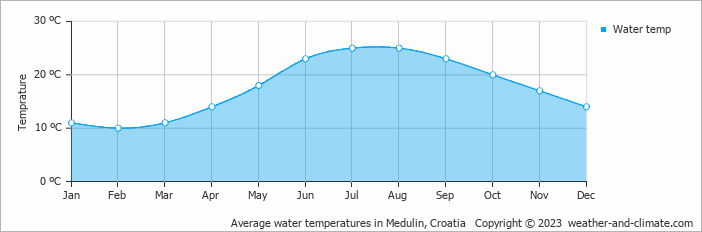
Data from: Medulin, Croatia (16 KM, 10 Miles).

Vodnjan experiences water temperature shifts throughout the year. The warmest month, July, reaches an average of 25°C.

The coldest month, February, averages 10°C. Visitors during these months can leave their swimming gear at home.


Forecast for Vodnjan

Monday
31 Mar
Light rain showers
Light rain showers
14°C
1.2 mm
Tuesday
1 Apr
Cloudy
Cloudy
12°C
0 mm
Wednesday
2 Apr
Partly cloudy
Partly cloudy
16°C
0 mm

Interested in more climate information?

This site provides you with all the information you need about the climate in Vodnjan.

Our site offers climate and forecast data for every country in the world. Are you going to Croatia? On this website you can find historical weather averages for many cities in Croatia. Not sure yet where to go? We now have a tool which recommends destinations that suit your ideal travel conditions. Find out where to go with our weather planner.

) ?>