Vetlanda Weather & Climate: Best Time to Visit
Average temperatures, rainfall, sunshine and the best time to visit Vetlanda.
Climate overview of Vetlanda
Vetlanda, Jönköping county, Sweden, sees big temperature differences between seasons, with July peaking at 22°C (72°F) and February dropping to 2°C (36°F).
The city receives around 723 mm (28 in) of rain/snowfall per year. July is the wettest month and March the driest. The sunniest month is June, with 7.6 hours of sunshine per day on average.
Vetlanda Weather by Month
Pick a month to see the average temperature, rainfall and sunshine in Vetlanda — and find the best time to visit.
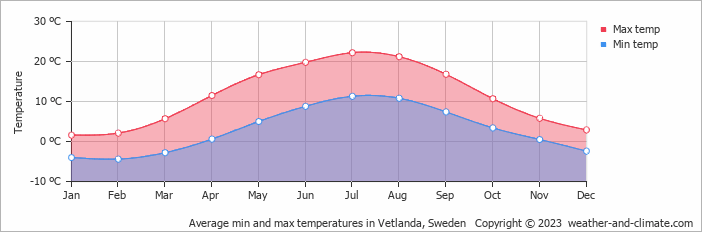
Monthly Temperature in Vetlanda
Visitors to Vetlanda can expect significant temperature changes throughout the year. On average, daytime temperatures range from a comfortable 22°C (72°F) in July to a very cold 2°C (36°F) in February.
Nighttime temperatures range from 11°C (52°F) in July to -4°C (25°F) in February.
Check out our detailed temperature page for more information.
Temperature ranges by month
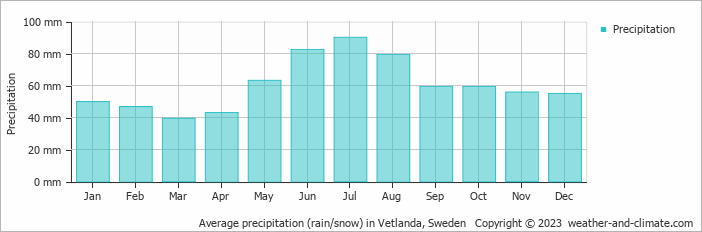
Rainfall in Vetlanda
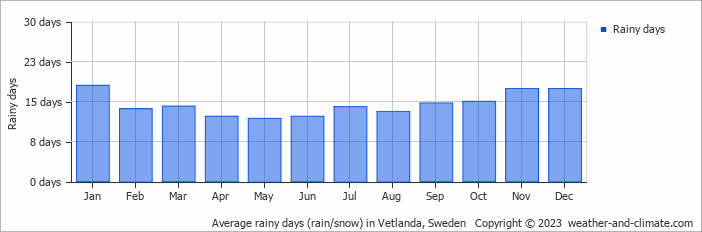
Generally, Vetlanda experiences moderate precipitation patterns, averaging 723 mm (28 in) yearly. The seasons in Vetlanda bring significant changes in precipitation. The wettest month, July, receives moderate rainfall, with an average of 90 mm (3.5 in) of precipitation. This rainfall is distributed across 14 rainy days.
In contrast, the driest month, March, experiences much less snow/rainfall, totaling 39 mm (1.5 in) over 14 snowy/rainy days. These distinct seasonal differences provide diverse experiences throughout the year. For more details, please visit our Vetlanda Precipitation page.
The mean monthly precipitation over the year, including rain, hail, and snow
The average number of days each month with precipitation
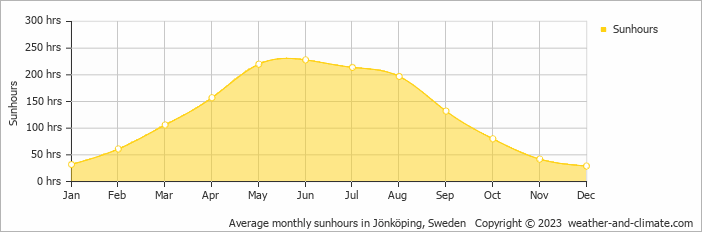
Sunshine Hours in Vetlanda
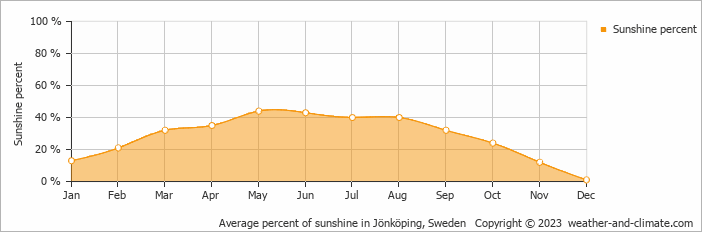
In Vetlanda, summer days are longer and more sunny, with daily sunshine hours peaking at 7.6 hours in June. As the darker season arrives, the brightness of the sun becomes less. December sees a soft sun for only 1.0 hours per average day.
Visit our detailed sunshine hours page for more information.
Monthly hours of sunshine
Daily hours of sunshine
Daily percentage of sunshine
Humidity in Vetlanda by Month
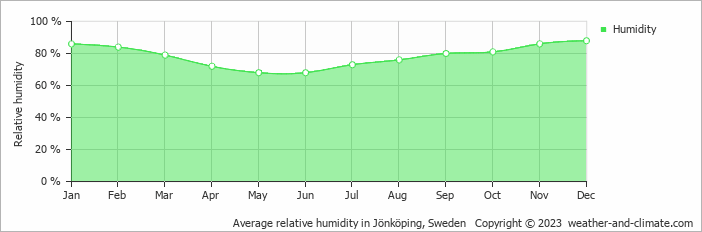
The relative humidity is high throughout the year in Vetlanda.
The city experiences its highest humidity in December, reaching 88%. In May, the humidity drops to its lowest level at 68%. What does this mean? Read our detailed page on humidity levels for further details.
Relative humidity over the year
Best Time to Visit Vetlanda
The weather does bring rainfall during this period, between 79 mm (3.1 in) and 90 mm (3.5 in). Looking for inspiration on where to travel this year? We have a tool that recommends destinations based on your ideal conditions. Find out where to go with our weather planner.
Frequently asked questions about the climate in Vetlanda
What is the best time to visit Vetlanda?
June, July and August typically offer the most optimal weather in Vetlanda. In contrast, January, February, March, November and December tend to have less optimal conditions.
What temperatures can I expect in Vetlanda?
Daytime highs range from 2°C (36°F) in February to 22°C (72°F) in July. Nighttime lows range from -4°C (25°F) to 11°C (52°F). Temperatures vary considerably through the year.
How much rain does Vetlanda get?
Annual rainfall is around 723 mm (28 in). July is the wettest month with 90 mm (3.5 in), while March is the driest with 39 mm (1.5 in).
How sunny is Vetlanda?
Vetlanda receives around 1,498 hours of sunshine per year. June is the sunniest month with 228 hours, while December is the cloudiest with just 29 hours.
Vetlanda 3-Day Forecast
Vetlanda 3-Day Forecast
Vetlanda on the map
Vetlanda is highlighted — select any city to see its climate.
Popular this month
Where to go in June — average daytime high across popular destinations.
Bucket list
Need travel inspiration? Check out our bucket list articles and be inspired.
 Stockholm is one of the most beautiful cities in the world
The Swedish capital is special because of the mix of culture, nature and city. It's a city that should be on everyone's bucket list.
Nordic skating in Sweden
In between the snowy hills and dense pine forests you will find an innumerable amount of lakes in Sweden, large and small ones on which you can skate wonderfully.
Sleep among the trees in Sweden
If you are looking for a tranquil retreat in Swedish Lapland we recommend to stay at Granó Beckasin. It has a fantastic location on the Ume river where you will experience silence and tranquility.
 See the northern lights
The northern lights, polar light or Aarora Borealis is a true spectacle of nature! Green, sometimes purple, red and yellow streaks of light colors the dark skies.