Vester Vidstrup Weather & Climate: Best Time to Visit
Average temperatures, rainfall, sunshine and the best time to visit Vester Vidstrup.
Climate overview of Vester Vidstrup
Temperatures in Vester Vidstrup, Denmark, vary greatly throughout the year. August is the hottest month at 21°C (70°F), while February is the coldest at 5°C (41°F).
Annual rain/snowfall is moderate at around 840 mm (33 in), with October being the wettest month. Sunshine peaks in June, when the city sees around 9.1 hours of sunshine per day.
Vester Vidstrup Weather by Month
Pick a month to see the average temperature, rainfall and sunshine in Vester Vidstrup — and find the best time to visit.
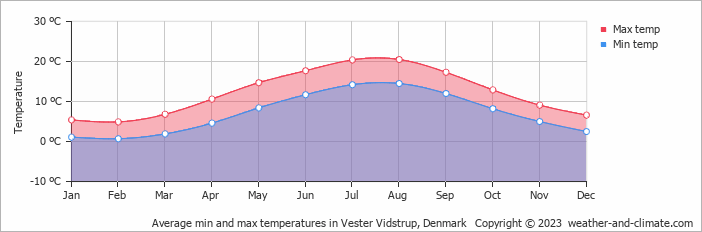
Monthly Temperature in Vester Vidstrup
The climate in Vester Vidstrup is known for significant temperature differences throughout the year, making the weather dynamic. Average daytime temperatures reach a pleasant 21°C (70°F) in August. In February, the coolest month of the year, temperatures drop to a chilly 5°C (41°F).
At night, temperatures range from around 15°C (59°F) in August to 1°C (34°F) in February.
Check out our detailed temperature page for more information.
Temperature ranges by month
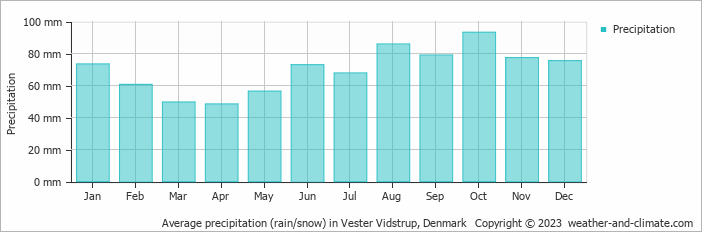
Rainfall in Vester Vidstrup
Generally, Vester Vidstrup receives mid-range precipitation levels, with 840 mm (33 in) annually. Vester Vidstrup experiences moderate seasonal variation in rainfall, with monthly averages ranging from 93 mm (3.7 in) in October, the wettest month, and 48 mm (1.9 in) in April, the driest month. For more details, please visit our Vester Vidstrup Precipitation page.
The mean monthly precipitation over the year, including rain, hail, and snow
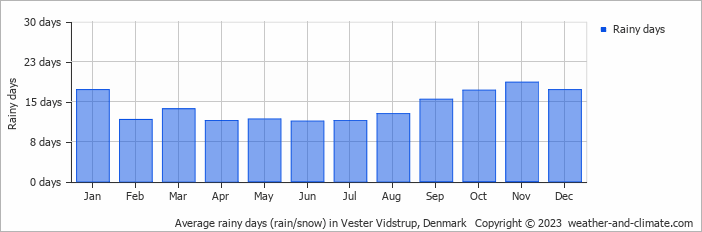
The average number of days each month with precipitation
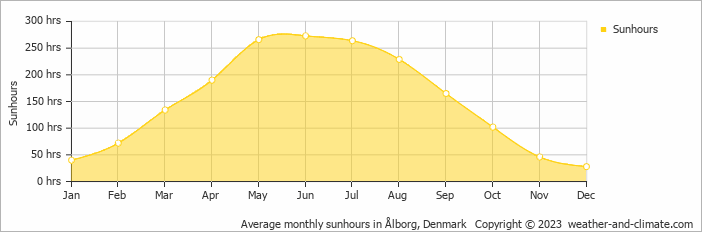
Sunshine Hours in Vester Vidstrup
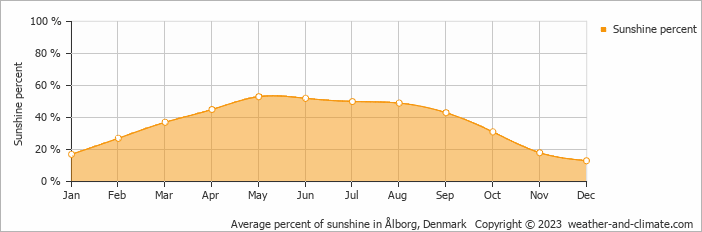
Vester Vidstrup can be enjoyed more throughout the sunniest month of June under a blue sky, with approximately 9.1 hours of sunshine daily. In contrast, the city experiences much darker days in December, with only 0.9 hours of sunlight per day.
Visit our detailed sunshine hours page for more information.
Monthly hours of sunshine
Daily hours of sunshine
Daily percentage of sunshine
Humidity in Vester Vidstrup by Month
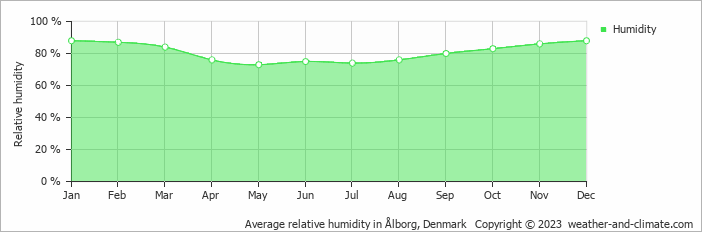
The city experiences its highest humidity in January, reaching 88%. In May, the humidity drops to its lowest level at 73%. What does this mean? Read our detailed page on humidity levels for further details.
Relative humidity over the year
Best Time to Visit Vester Vidstrup
Frequently asked questions about the climate in Vester Vidstrup
What is the best time to visit Vester Vidstrup?
July and August typically offer the most optimal weather in Vester Vidstrup. In contrast, January, February, March, November and December tend to have less optimal conditions.
What temperatures can I expect in Vester Vidstrup?
Daytime highs range from 5°C (41°F) in February to 21°C (70°F) in August. Nighttime lows range from 1°C (34°F) to 15°C (59°F). Temperatures vary considerably through the year.
How much rain does Vester Vidstrup get?
Annual rainfall is around 840 mm (33 in). October is the wettest month with 93 mm (3.7 in), while April is the driest with 48 mm (1.9 in).
How sunny is Vester Vidstrup?
Vester Vidstrup receives around 1,809 hours of sunshine per year. June is the sunniest month with 273 hours, while December is the cloudiest with just 28 hours.
Vester Vidstrup 3-Day Forecast
Vester Vidstrup 3-Day Forecast
Vester Vidstrup on the map
Vester Vidstrup is highlighted — select any city to see its climate.
Popular this month
Where to go in June — average daytime high across popular destinations.