Torup Strand Weather & Climate: Best Time to Visit
Temperatures in Torup Strand, Nordjylland, Denmark, vary greatly throughout the year. August is the hottest month at 20°C (68°F), while February is the coldest at 5°C (41°F).
The city receives around 935 mm (37 in) of rain/snowfall per year. October is the wettest month and April the driest. June is the sunniest month, averaging 9.1 hours of sunshine per day.
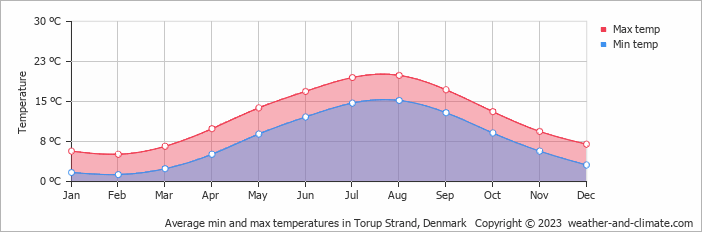
Monthly Temperature in Torup Strand
The climate in Torup Strand is known for significant temperature differences throughout the year, making the weather dynamic. On average, daytime temperatures range from a pleasant 20°C (68°F) in August to a chilly 5°C (41°F) in February.
Nighttime temperatures range from 15°C (59°F) in August to 1°C (34°F) in February.
Check out our detailed temperature page for more information.
Temperature ranges by month
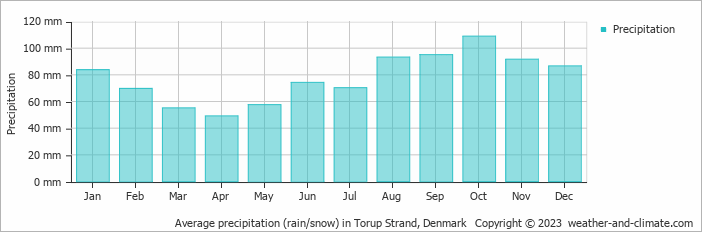
Rainfall in Torup Strand
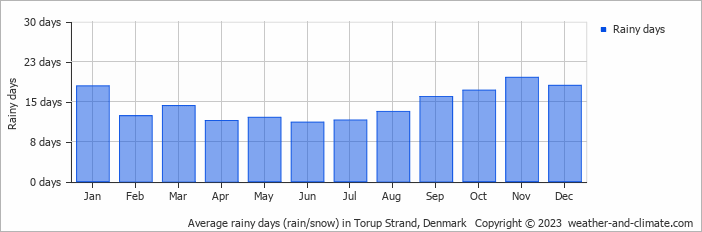
Generally, Torup Strand receives mid-range precipitation levels, with 935 mm (37 in) annually. The seasons in Torup Strand bring significant changes in precipitation. The wettest month, October, receives high rainfall, with an average of 109 mm (4.3 in) of precipitation. This rainfall is distributed across 17 rainy days.
In contrast, the driest month, April, experiences much less rainfall, totaling 49 mm (1.9 in) over 11 rainy days. These distinct seasonal differences provide diverse experiences throughout the year. For more details, please visit our Torup Strand Precipitation page.
The mean monthly precipitation over the year, including rain, hail, and snow
The average number of days each month with precipitation
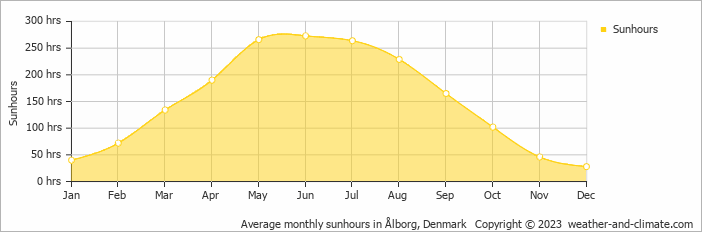
Sunshine Hours in Torup Strand
In Torup Strand, summer days are longer and more sunny, with daily sunshine hours peaking at 9.1 hours in June. As the darker season arrives, the brightness of the sun becomes less. December sees a soft sun for only 0.9 hours per average day.
Visit our detailed sunshine hours page for more information.
Monthly hours of sunshine
Daily hours of sunshine
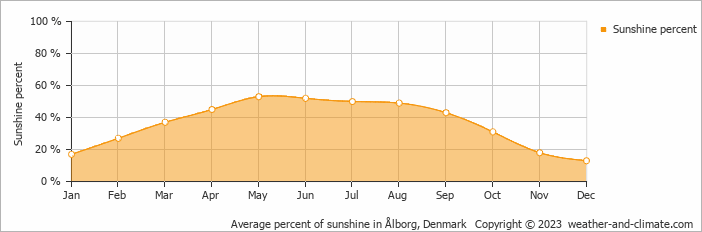
Daily percentage of sunshine
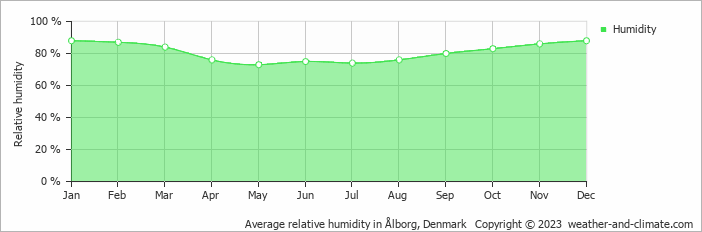
Humidity in Torup Strand by Month
The city experiences its highest humidity in January, reaching 88%. In May, the humidity drops to its lowest level at 73%. What does this mean? Read our detailed page on humidity levels for further details.
Relative humidity over the year
Torup Strand 3-Day Forecast
Check the conditions for any month of the year.


