Tabdi Climate by Month
Tabdi experiences great temperature shifts.
The city's weather can transition from warm days
to cold weather.
It maintains moderate precipitation patterns.
Now, let’s explore all the climate details to give you a full picture.
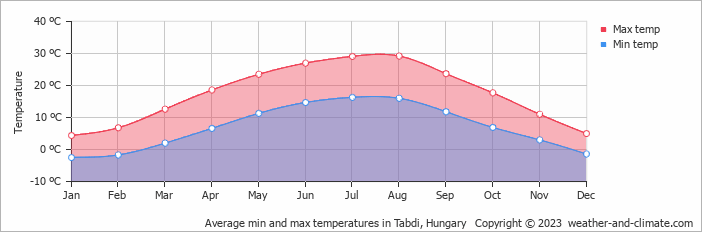
Average day and night temperature
The climate in Tabdi is known for significant temperature differences throughout the year, making the weather dynamic. Typically, daytime temperatures range from a comfortable 29°C in August to a chilly 4°C in the coolest month, January. Nights are cooler, with temperatures generally dropping to -3°C, particularly during the colder months.
The mean minimum and maximum temperatures throughout the year
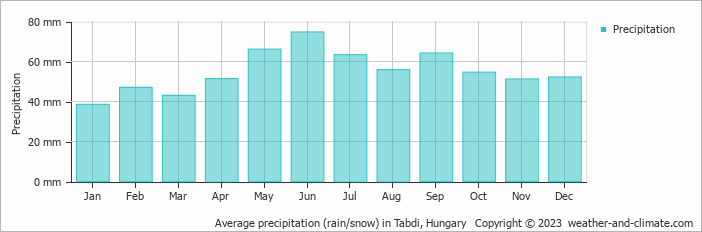
Precipitation and rainy days
Generally, Tabdi receives mid-range precipitation levels, with 662 mm annually. Tabdi offers a pleasant mix of wetter and slightly drier months. The difference in precipitation between June (75 mm) and January (39 mm) is not too significant, making the climate enjoyable for visitors and residents alike.The mean monthly precipitation over the year, including rain, hail and snow
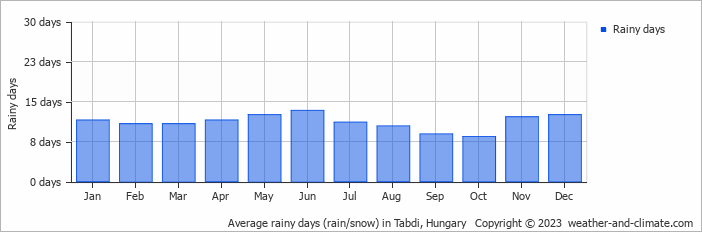
The average number of days each month with precipitation
The best time of year to visit Tabdi in Hungary
During the months of May and September you are most likely to experience good weather with pleasant average temperatures that fall between 20°C and 26°C.Other facts from our historical weather data:
August has an average maximum temperature of 29°C and is the warmest month of the year.
The coldest month is January with an average maximum temperature of 4°C.
June tops the wettest month list with 75 mm of rainfall.
January is the driest month with 39 mm of precipitation.
No idea where to travel to this year? We have a tool that recommends destinations based on your ideal conditions. Find out where to go with our weather planner.


