Tabarka Weather & Climate: Best Time to Visit
The climate in Tabarka, Jendouba Governorate, Tunisia, is marked by large temperature swings across the seasons, ranging from 30°C (86°F) in August to 15°C (59°F) in February.
The city has a wet climate, receiving around 1056 mm (42 in) of rainfall per year. Despite the high annual total, it has a distinct dry season from June to August. December is the wettest month. Sunshine peaks in July, when the city sees around 11.5 hours of sunshine per day.
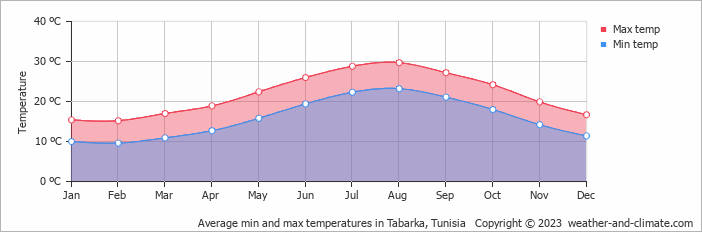
Monthly Temperature in Tabarka
In Tabarka, temperatures differ significantly between summer and winter months. On average, daytime temperatures range from a comfortable 30°C (86°F) in August to a moderate 15°C (59°F) in February.
Nighttime temperatures range from 23°C (73°F) in August to 10°C (50°F) in February.
Check out our detailed temperature page for more information.
Temperature ranges by month
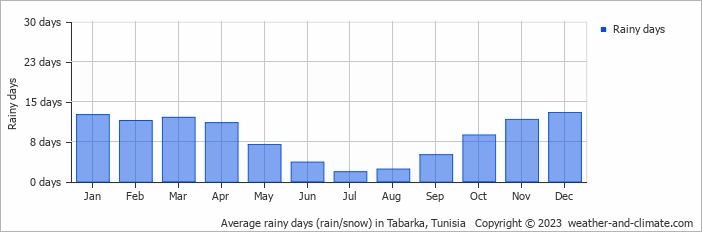
Rainfall in Tabarka
Tabarka experiences significant rainfall throughout the year, averaging 1056 mm (42 in) of precipitation annually. The seasons in Tabarka bring significant changes in precipitation. The wettest month, December, receives heavy rainfall, with an average of 165 mm (6.5 in) of precipitation. This rainfall is distributed across 13 rainy days.
In contrast, the driest month, July, experiences much less rainfall, totaling 3.6 mm (0.1 in) over 2 rainy days. These distinct seasonal differences provide diverse experiences throughout the year. For more details, please visit our Tabarka Precipitation page.
The mean monthly precipitation over the year, including rain, hail, and snow

The average number of days each month with precipitation
Sunshine Hours in Tabarka
In Tabarka, summer days are longer and more sunny, with daily sunshine hours peaking at 11.5 hours in July. As the darker season arrives, the brightness of the sun becomes less. January sees a soft sun for only 4.8 hours per average day.
Visit our detailed sunshine hours page for more information.
Monthly hours of sunshine

Daily hours of sunshine
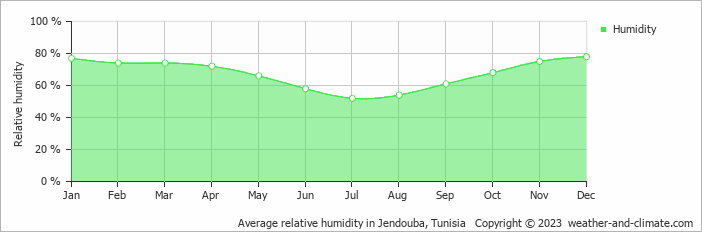
Humidity in Tabarka by Month
The relative humidity is high throughout the year in Tabarka.
The city experiences its highest humidity in December, reaching 78%. In July, the humidity drops to its lowest level at 52%. What does this mean? Read our detailed page on humidity levels for further details.
Relative humidity over the year
Tabarka 3-Day Forecast
Check the conditions for any month of the year.
Best Time to Visit Tabarka
The best time to visit Tabarka is during April, May, June, July, August, September and October, when the weather provides comfortable temperatures between 19°C (66°F) and 30°C (85°F). With rainfall of 4 mm (0.2 in) to 94 mm (3.7 in), you can expect pleasant weather during your visit in these months.Be prepared for heavier rainfall during December, the wettest period of the year. Looking for inspiration on where to travel this year? We have a tool that recommends destinations based on your ideal conditions. Find out where to go with our weather planner.