Szada Weather & Climate: Best Time to Visit
Average temperatures, rainfall, sunshine and the best time to visit Szada.
Climate overview of Szada
Szada, Pest, Hungary, experiences significant temperature variation throughout the year. Summers bring daytime highs of 29°C (84°F) in July, while winters cool to 4°C (39°F) in January.
With around 668 mm (26 in) of annual rain/snowfall, the city has moderate precipitation levels. June is the wettest month and January the driest. The sunniest month is July, with 9.3 hours of sunshine per day on average.
Szada Weather by Month
Pick a month to see the average temperature, rainfall and sunshine in Szada — and find the best time to visit.
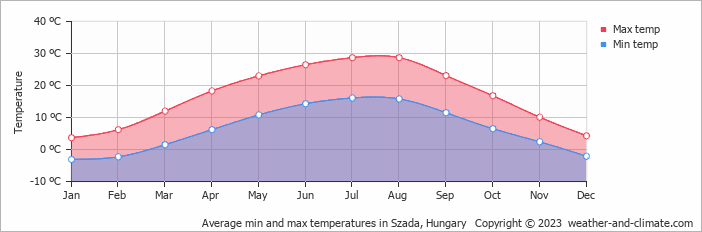
Monthly Temperature in Szada
Depending on the time of the year, temperatures range from comfortable to chilly in Szada. Typically, average maximum daytime temperatures range from a comfortable 29°C (84°F) in July to a chilly 4°C (39°F) in the coolest month, January.
Nights vary from 16°C (61°F) in July to around -3°C (27°F) during the colder months.
Check out our detailed temperature page for more information.
Temperature ranges by month
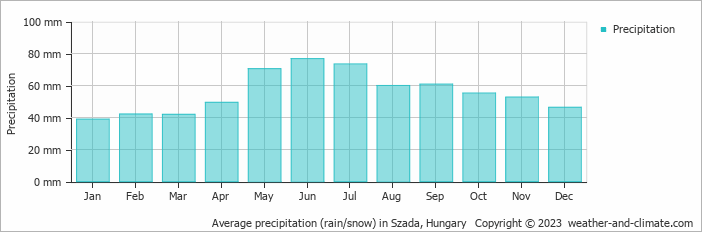
Rainfall in Szada
Generally, Szada has a moderate amount of precipitation, averaging 668 mm (26 in) of rain/snowfall annually. Szada offers a pleasant mix of wetter and slightly drier months. The difference in precipitation between the wettest month June (77 mm (3 in)) and the driest month January (39 mm (1.5 in)) is not too significant. For more details, please visit our Szada Precipitation page.
The mean monthly precipitation over the year, including rain, hail, and snow
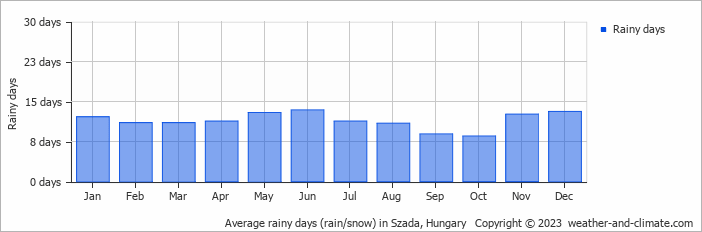
The average number of days each month with precipitation
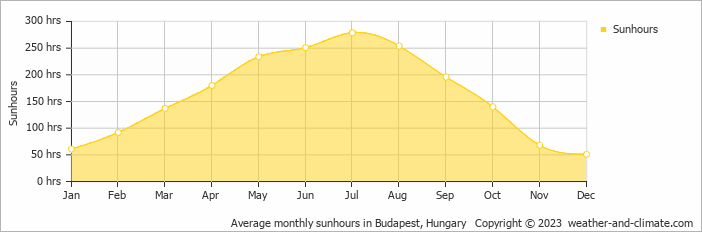
Sunshine Hours in Szada
For those who appreciate different seasons, Szada serves as an ideal destination. Expect longer, more sun-filled days in July with an average of 9.3 hours of sunshine daily, and embrace the darker days in December, offering only 1.7 hours of daily sunlight.
Visit our detailed sunshine hours page for more information.
Monthly hours of sunshine
Daily hours of sunshine
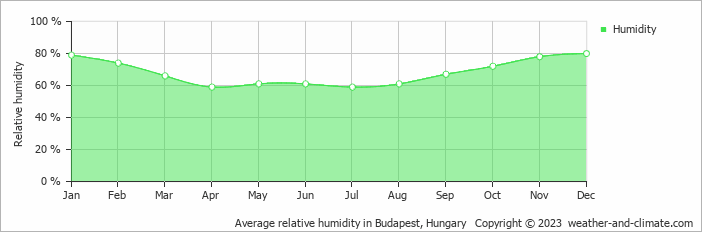
Humidity in Szada by Month
The relative humidity is high throughout the year in Szada.
The city experiences its highest humidity in December, reaching 80%. In April, the humidity drops to its lowest level at 59%. What does this mean? Read our detailed page on humidity levels for further details.
Relative humidity over the year
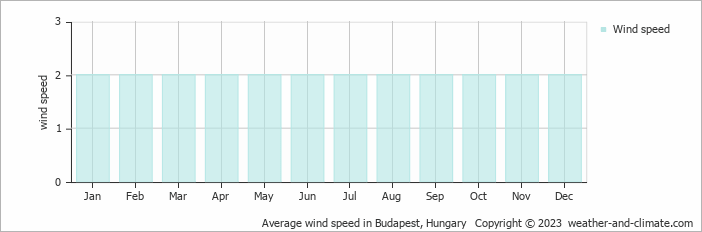
Wind Speed in Szada
The average wind speed over the year ranges from 2 m/s (4 knots) to 2 m/s (4 knots). It is lower in January, February, March, April, May, June, July, August, September, October, November and December and higher in January, February, March, April, May, June, July, August, September, October, November and December. What does this mean?
The mean monthly wind speed over the year (meters per second)
Best Time to Visit Szada
Rainfall during this time ranges from 49 mm (1.9 in) in April to 77 mm (3 in) in June. This means you can expect a mix of sunny days and occasional showers. Planning your next adventure but unsure where to go? Our climate tool suggests perfect locations tailored to your preferred weather conditions. Discover your ideal travel destination with our weather planner.
Frequently asked questions about the climate in Szada
What is the best time to visit Szada?
May, June, July, August and September typically offer the most optimal weather in Szada. In contrast, January, February, November and December tend to have less optimal conditions.
What temperatures can I expect in Szada?
Daytime highs range from 4°C (39°F) in January to 29°C (84°F) in July. Nighttime lows range from -3°C (27°F) to 16°C (61°F). Temperatures vary considerably through the year.
How much rain does Szada get?
Annual rainfall is around 668 mm (26 in). June is the wettest month with 77 mm (3 in), while January is the driest with 39 mm (1.5 in).
How sunny is Szada?
Szada receives around 1,943 hours of sunshine per year. July is the sunniest month with 279 hours, while December is the cloudiest with just 51 hours.
Szada 3-Day Forecast
Szada 3-Day Forecast
Szada on the map
Szada is highlighted — select any city to see its climate.
Popular this month
Where to go in June — average daytime high across popular destinations.
Bucket list
Need travel inspiration? Check out our bucket list articles and be inspired.
 7 of the most budget-friendly destinations in Europe
Discover Europe's top budget-friendly destinations including Budapest, Kotor, Krakow, and more, perfect for affordable and exciting travel.
Sziget Festival
Sziget Hungary is the largest open-air festival in Europe. The festival takes place seven days and you can enjoy more than 1,000 performances on 60 different stages.
 Cycle the Danube trail
The Danube cycle route is one of the most popular cycling routes in Europe, and rightly so, because it is a varied route that is interesting both in terms of culture and nature.