Sindrup Weather & Climate: Best Time to Visit
Temperatures in Sindrup, Nordjylland, Denmark, vary greatly throughout the year. August is the hottest month at 21°C (70°F), while February is the coldest at 5°C (41°F).
With around 903 mm (36 in) of annual rain/snowfall, the city has moderate precipitation levels. October is the wettest month and April the driest. June is the sunniest month, averaging 8.3 hours of sunshine per day.
Monthly Temperature in Sindrup
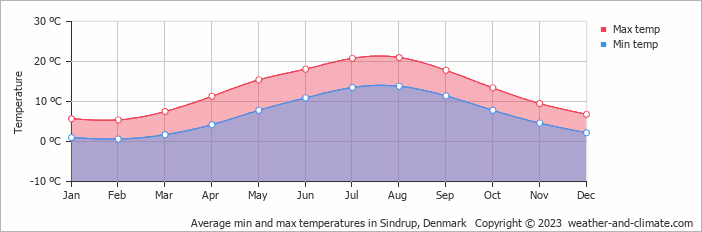
The climate in Sindrup is known for significant temperature differences throughout the year, making the weather dynamic. Typically, average maximum daytime temperatures range from a pleasant 21°C (70°F) in August to a chilly 5°C (41°F) in the coolest month, February.
Nights vary from 14°C (57°F) in August to around 1°C (34°F) during the colder months.
Check out our detailed temperature page for more information.
Temperature ranges by month
Rainfall in Sindrup
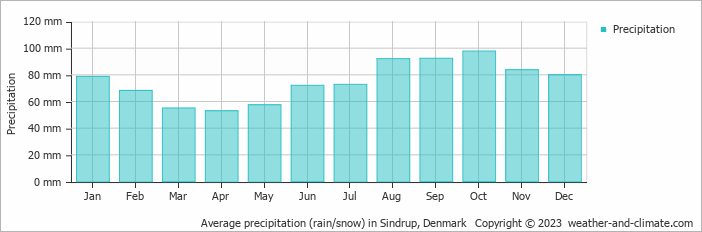
Generally, Sindrup receives mid-range precipitation levels, with 903 mm (36 in) annually. Sindrup offers a pleasant mix of wetter and slightly drier months. The difference in precipitation between the wettest month October (98 mm (3.9 in)) and the driest month April (53 mm (2.1 in)) is not too significant. For more details, please visit our Sindrup Precipitation page.
The mean monthly precipitation over the year, including rain, hail, and snow
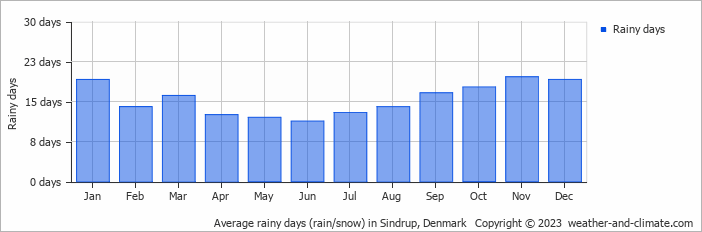
The average number of days each month with precipitation
Sunshine Hours in Sindrup
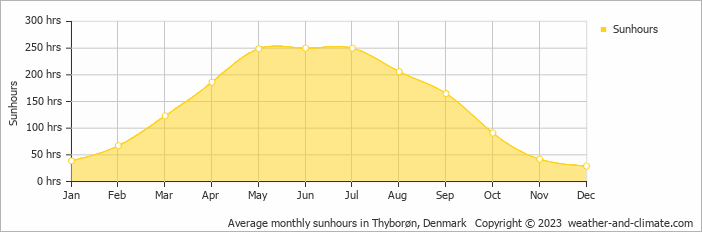
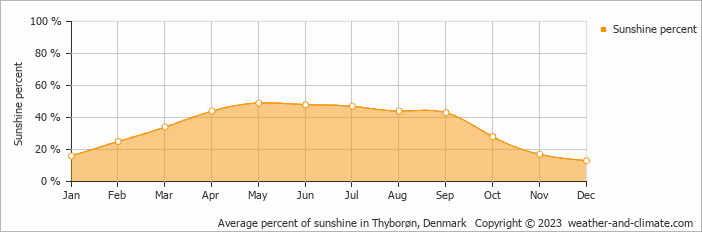
For those who appreciate different seasons, Sindrup serves as an ideal destination. Expect longer, more sun-filled days in June with an average of 8.3 hours of sunshine daily, and embrace the darker days in December, offering only 1.0 hours of daily sunlight.
Visit our detailed sunshine hours page for more information.
Monthly hours of sunshine
Daily hours of sunshine
Daily percentage of sunshine
Water Temperature in Sindrup
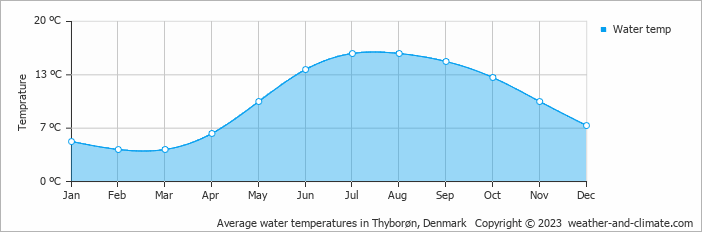
The mean water temperature over the year ranges from 4°C (39°F) in February to 16°C (61°F) in July.
Water temperature over the year
Humidity in Sindrup by Month
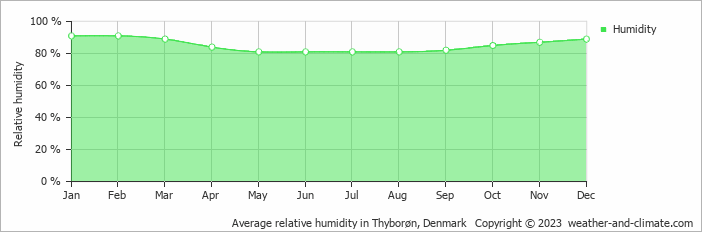
The city experiences its highest humidity in January, reaching 91%. In May, the humidity drops to its lowest level at 81%. What does this mean? Read our detailed page on humidity levels for further details.
Relative humidity over the year
Wind Speed in Sindrup
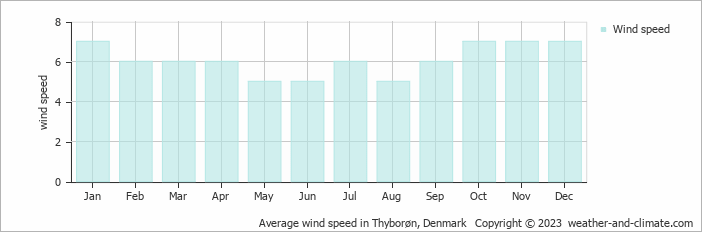
The average wind speed over the year ranges from 5 m/s (10 knots) to 7 m/s (14 knots). It is lower in May, June and August and higher in January, October, November and December. What does this mean?
The mean monthly wind speed over the year (meters per second)
Sindrup 3-Day Forecast
Check the conditions for any month of the year.


