Santa Bárbara de Samaná Weather & Climate: Best Time to Visit
Average temperatures, rainfall, sunshine and the best time to visit Santa Bárbara de Samaná.
Climate overview of Santa Bárbara de Samaná
With consistently stable weather, Santa Bárbara de Samaná, Dominican Republic, sees little seasonal temperature change. Daytime highs average 30°C (86°F), ranging from 31°C (88°F) in August to 28°C (82°F) in February.
Rainfall is high, totalling around 1292 mm (51 in) per year. May is the wettest month and February the driest.
Santa Bárbara de Samaná Weather by Month
Pick a month to see the average temperature, rainfall and sunshine in Santa Bárbara de Samaná — and find the best time to visit.
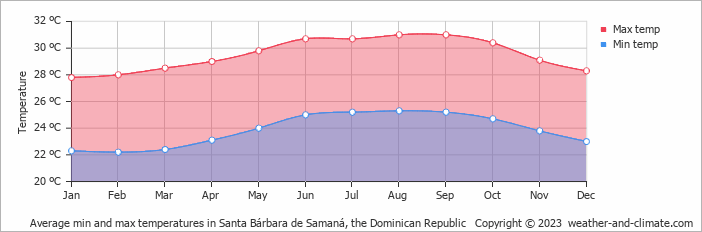
Monthly Temperature in Santa Bárbara de Samaná
The climate in Santa Bárbara de Samaná remains fairly constant, offering comfortable temperatures throughout the year. Average maximum daytime temperatures range from a very warm 31°C (88°F) in August, the warmest time of the year, to a comfortable 28°C (82°F) during cooler months like February.
At night, you can expect temperatures ranging from 25°C (77°F) in August to around 22°C (72°F) during February.
Check out our detailed temperature page for more information.
Temperature ranges by month
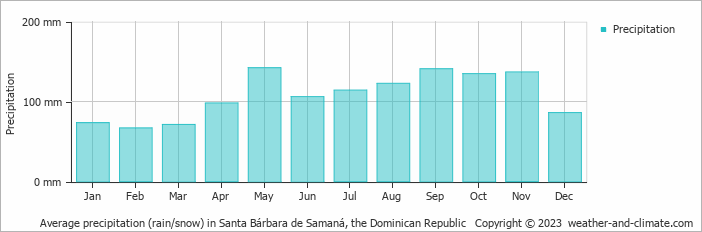
Rainfall in Santa Bárbara de Samaná
Santa Bárbara de Samaná is known for its substantial rainfall, with annual precipitation reaching 1292 mm (51 in). While rainfall varies throughout the year, each season offers its own charm. May brings wetter days averaging 142 mm (5.6 in) of precipitation, spread over 13 rainy days.
In contrast, the driest month February experiences a drier climate, with about 67 mm (2.6 in) of rainfall spread across 11 rainy days. For more details, please visit our Santa Bárbara de Samaná Precipitation page.
The mean monthly precipitation over the year, including rain, hail, and snow
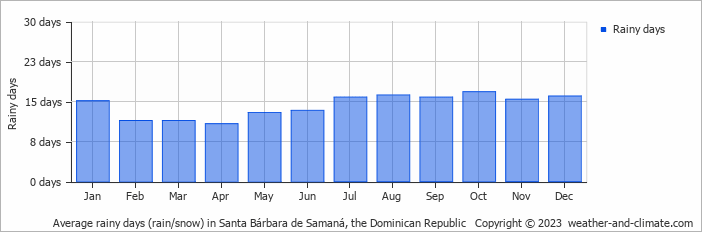
The average number of days each month with precipitation
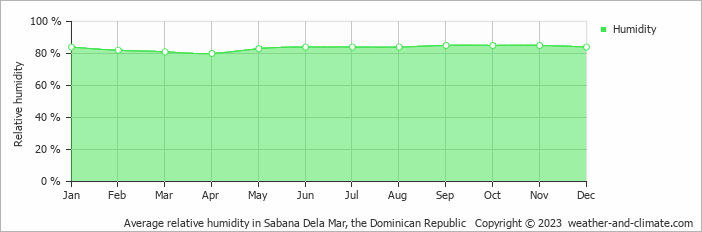
Humidity in Santa Bárbara de Samaná by Month
The city experiences its highest humidity in September, reaching 85%. In April, the humidity drops to its lowest level at 80%. What does this mean? Read our detailed page on humidity levels for further details.
Relative humidity over the year
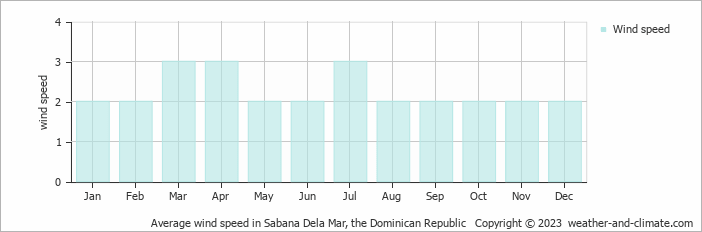
Wind Speed in Santa Bárbara de Samaná
The average wind speed over the year ranges from 2 m/s (4 knots) to 3 m/s (6 knots). It is lower in January, February, May, June, August, September, October, November and December and higher in March, April and July. What does this mean?
The mean monthly wind speed over the year (meters per second)
Best Time to Visit Santa Bárbara de Samaná
Make your experience more enjoyable by planning to be outside during the cooler parts of the day, either early morning or as the sun begins to set. Seeking the perfect travel destination for this year? We've created a tool that suggests locations matching your desired weather. Let our weather planner guide your travel decisions.
Frequently asked questions about the climate in Santa Bárbara de Samaná
What is the best time to visit Santa Bárbara de Samaná?
January, February, March, April and December typically offer the most optimal weather in Santa Bárbara de Samaná. In contrast, May, June, July, August, September and October tend to have less optimal conditions.
What temperatures can I expect in Santa Bárbara de Samaná?
Daytime highs range from 28°C (82°F) in February to 31°C (88°F) in August. Nighttime lows range from 22°C (72°F) to 25°C (77°F). Temperatures stay relatively stable year-round.
How much rain does Santa Bárbara de Samaná get?
Annual rainfall is around 1292 mm (51 in). May is the wettest month with 142 mm (5.6 in), while February is the driest with 67 mm (2.6 in).
Santa Bárbara de Samaná 3-Day Forecast
Santa Bárbara de Samaná 3-Day Forecast
Santa Bárbara de Samaná on the map
Santa Bárbara de Samaná is highlighted — select any city to see its climate.
Popular this month
Where to go in June — average daytime high across popular destinations.
Bucket list
Need travel inspiration? Check out our bucket list articles and be inspired.
 5 Tranquil Spots in the Dominican Republic
Explore the hidden gems of the Dominican Republic, from Bahía de Las Águilas to Constanza. Discover tranquil beaches, mountains, and green landscapes.
Windsurf in Cabarete
The best travel time for Cabarete in the Dominican Republic is from January to April, June to October and December. If you like Wind Surfing than you must add the surf paradise Cabarete on your bucket list.