Ryd Weather & Climate: Best Time to Visit
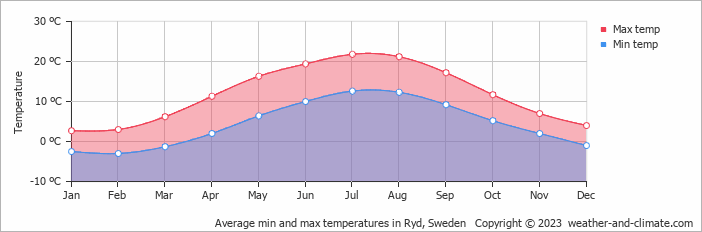
Ryd, Kronoberg, Sweden, sees big temperature differences between seasons, with July peaking at 22°C (72°F) and February dropping to 3°C (37°F).
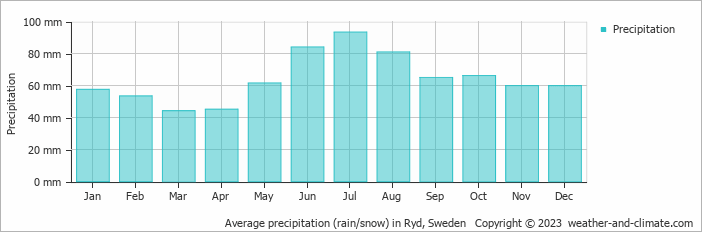
Ryd sees a moderate amount of rain/snowfall, totalling around 770 mm (30 in) per year.
Monthly Temperature in Ryd
Visitors to Ryd can expect significant temperature changes throughout the year. Average maximum daytime temperatures range from a pleasant 22°C (72°F) in July, the warmest time of the year, to a chilly 3°C (37°F) during cooler months like February.
At night, you can expect temperatures ranging from 13°C (55°F) in July to around -3°C (27°F) during February.
Check out our detailed temperature page for more information.
Temperature ranges by month
Rainfall in Ryd
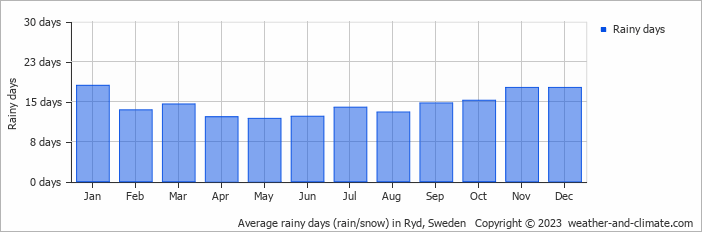
Generally, Ryd experiences moderate precipitation patterns, averaging 770 mm (30 in) yearly. While rainfall varies throughout the year, each season offers its own charm. July brings wetter days averaging 93 mm (3.7 in) of precipitation, spread over 14 rainy days.
In contrast, the driest month March experiences a drier climate, with about 44 mm (1.7 in) of snow/rainfall spread across 15 snowy/rainy days. For more details, please visit our Ryd Precipitation page.
The mean monthly precipitation over the year, including rain, hail, and snow
The average number of days each month with precipitation
Ryd 3-Day Forecast
Check the conditions for any month of the year.
Best Time to Visit Ryd
During June, July and August, Ryd experiences its most favorable weather, with temperatures between 19°C (67°F) and 22°C (71°F). These mild conditions make it an excellent time for a visit.The weather does bring rainfall during this period, between 81 mm (3.2 in) and 93 mm (3.7 in). Need help choosing your next travel destination? We offer a specialized tool that matches you with locations based on your weather preferences. Explore destinations that suit your climate preferences.