Ribe Weather & Climate: Best Time to Visit
Average temperatures, rainfall, sunshine and the best time to visit Ribe.
Climate overview of Ribe
Ribe, Syddanmark, Denmark, sees big temperature differences between seasons, with August peaking at 21°C (70°F) and February dropping to 5°C (41°F).
The city receives around 929 mm (37 in) of rain/snowfall per year. August is the wettest month and April the driest. The sunniest month is June, with 8.5 hours of sunshine per day on average.
Ribe Weather by Month
Pick a month to see the average temperature, rainfall and sunshine in Ribe — and find the best time to visit.
Monthly Temperature in Ribe
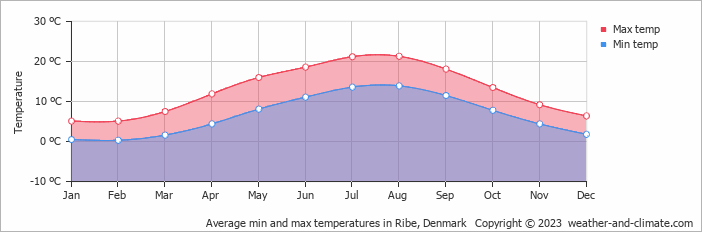
Visitors to Ribe can expect significant temperature changes throughout the year. On average, daytime temperatures range from a pleasant 21°C (70°F) in August to a chilly 5°C (41°F) in February.
Nighttime temperatures range from 14°C (57°F) in August to 0°C (32°F) in February.
Check out our detailed temperature page for more information.
Temperature ranges by month
Rainfall in Ribe
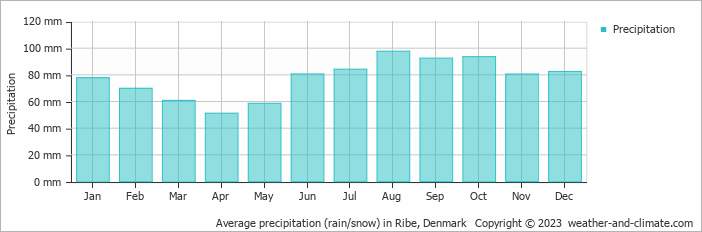
Generally, Ribe experiences moderate precipitation patterns, averaging 929 mm (37 in) yearly. The amount of precipitation varies moderately throughout the year. The wettest month, August, sees around 98 mm (3.9 in) of rainfall, perfect for those who enjoy a bit of rain now and then. The driest month, April, still receives a respectable 51 mm (2 in) of rainfall. For more details, please visit our Ribe Precipitation page.
The mean monthly precipitation over the year, including rain, hail, and snow
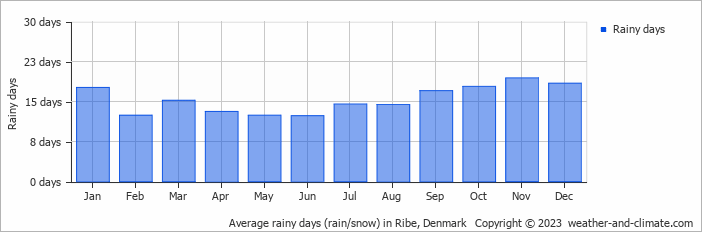
The average number of days each month with precipitation
Sunshine Hours in Ribe
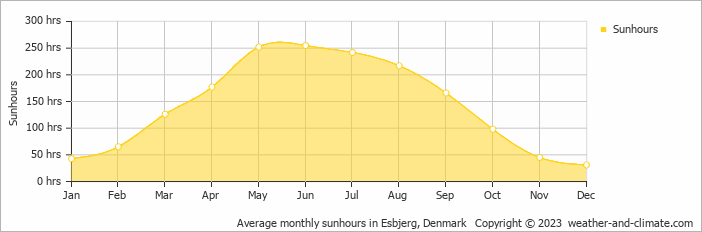
In Ribe, summer days are longer and more sunny, with daily sunshine hours peaking at 8.5 hours in June. As the darker season arrives, the brightness of the sun becomes less. December sees a soft sun for only 1.0 hours per average day.
Visit our detailed sunshine hours page for more information.
Monthly hours of sunshine
Daily hours of sunshine
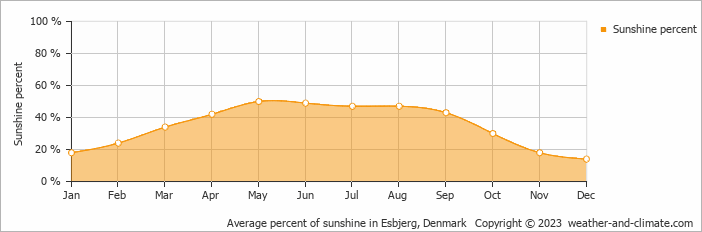
Daily percentage of sunshine
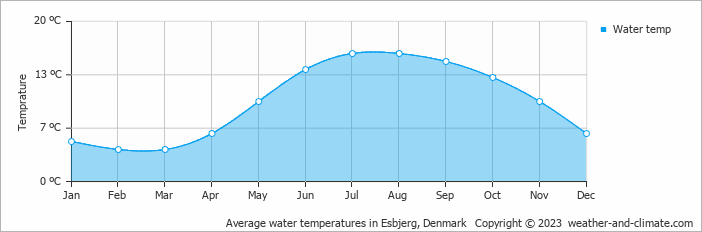
Water Temperature in Ribe
The mean water temperature over the year ranges from 4°C (39°F) in February to 16°C (61°F) in July.
Water temperature over the year
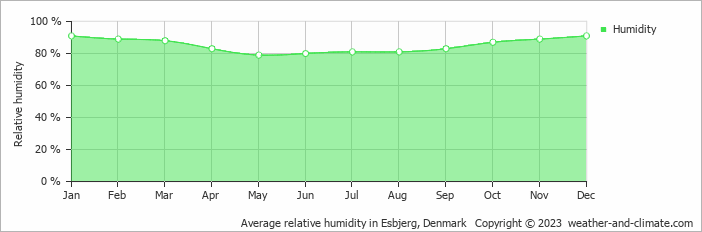
Humidity in Ribe by Month
The city experiences its highest humidity in January, reaching 91%. In May, the humidity drops to its lowest level at 79%. What does this mean? Read our detailed page on humidity levels for further details.
Relative humidity over the year
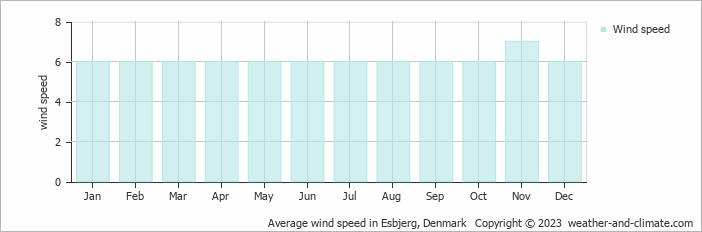
Wind Speed in Ribe
The mean wind speed over the year ranges from 6 m/s (12 knots) in January, February, March, April, May, June, July, August, September, October and December to 7 m/s (14 knots) in November. What does this mean?
The mean monthly wind speed over the year (meters per second)
Best Time to Visit Ribe
The weather does bring rainfall during this period, between 81 mm (3.2 in) and 98 mm (3.9 in). Need help choosing your next travel destination? We offer a specialized tool that matches you with locations based on your weather preferences. Explore destinations that suit your climate preferences.
Frequently asked questions about the climate in Ribe
What is the best time to visit Ribe?
July and August typically offer the most optimal weather in Ribe. In contrast, January, February, March, November and December tend to have less optimal conditions.
What temperatures can I expect in Ribe?
Daytime highs range from 5°C (41°F) in February to 21°C (70°F) in August. Nighttime lows range from 0°C (32°F) to 14°C (57°F). Temperatures vary considerably through the year.
How much rain does Ribe get?
Annual rainfall is around 929 mm (37 in). August is the wettest month with 98 mm (3.9 in), while April is the driest with 51 mm (2 in).
How sunny is Ribe?
Ribe receives around 1,717 hours of sunshine per year. June is the sunniest month with 255 hours, while December is the cloudiest with just 31 hours.
Ribe 3-Day Forecast
Ribe 3-Day Forecast
Ribe on the map
Ribe is highlighted — select any city to see its climate.
Popular this month
Where to go in June — average daytime high across popular destinations.